主管:中国科学院
主办:中国优选法统筹法与经济数学研究会
中国科学院科技战略咨询研究院
主办:中国优选法统筹法与经济数学研究会
中国科学院科技战略咨询研究院
中国管理科学 ›› 2025, Vol. 33 ›› Issue (8): 1-13.doi: 10.16381/j.cnki.issn1003-207x.2024.1601
• •
姚银红, 王晓旭, 陈炜, 陈振松( )
)
收稿日期:2024-09-13
修回日期:2024-10-22
出版日期:2025-08-25
发布日期:2025-09-10
通讯作者:
陈振松
E-mail:chenzhensong@cueb.edu.cn
基金资助:
Yinhong Yao, Xiaoxu Wang, Wei Chen, Zhensong Chen()
Received:2024-09-13
Revised:2024-10-22
Online:2025-08-25
Published:2025-09-10
Contact:
Zhensong Chen
E-mail:chenzhensong@cueb.edu.cn
摘要:
全球经济不确定性的增加和极端事件的频发使得精确测度全球股市极端风险溢出效应成为应对跨国金融冲击的重要途径。现有研究在综合考虑时间序列非线性、长期依赖性和多变量交互影响方面存在一定的局限性。因此,本文提出Transformer-LSTM分位数回归模型,在提取数据时序特征的同时,利用Transformer中的多头注意力机制并行处理多个注意力函数,以更精确地捕捉全球股市极端风险的时间演变特征,并构建溢出网络测度全样本和金融危机等危机事件发生期间的风险溢出效应。基于2001年12月—2024年3月共19个国家周度股指数据的实证结果表明:(1)本文提出的模型相较于多层感知机(MLP)、长短期记忆网络(LSTM)以及Transformer具有更强的预测能力。(2)各国股市在全样本期间的溢出效应具有非对称性,其中,美国股市存在显著的风险溢出效应,中国股市没有明显的风险溢出和接收效应。(3)危机事件发生时,极端风险溢出效应增加且非对称性增强。金融危机期间,美国股市风险溢出效应显著,多国存在显著的双向溢出效应;欧债危机期间,风险溢出效应主要集中在欧洲国家的股票市场;中美贸易摩擦期间,美国股市对中国股市的风险冲击明显增强;新冠疫情期间,美国、英国等发达国家股市仍是主要的风险溢出源。本文提出的模型为金融市场的极端风险溢出研究提供了新思路,研究结果对危机时期的全球股市风险管理具有重要的参考借鉴价值。
中图分类号:
姚银红, 王晓旭, 陈炜, 陈振松. 基于Transformer-LSTM分位数回归的全球股市极端风险溢出研究[J]. 中国管理科学, 2025, 33(8): 1-13.
Yinhong Yao, Xiaoxu Wang, Wei Chen, Zhensong Chen. Extreme Risk Spillover among Global Stock Markets Based on Transformer-LSTM Quantile Regression[J]. Chinese Journal of Management Science, 2025, 33(8): 1-13.
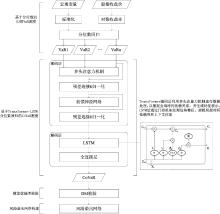
图1
研究框架和流程"

表1
全球股指收益率描述性统计"
| 股市 | 均值 | 最大值 | 最小值 | 标准差 | 偏度 | 峰度 | JB检验 | ARCH检验 | ADF检验 |
|---|---|---|---|---|---|---|---|---|---|
| 中国 | 0.049 | 13.945 | -14.898 | 3.191 | -0.202 | 2.618 | 324.379*** | 311.587*** | -17.426*** |
| 奥地利 | 0.136 | 11.424 | -29.933 | 2.545 | -1.775 | 20.324 | 19752.867*** | 83.373*** | -20.962*** |
| 澳大利亚 | 0.119 | 15.817 | -36.255 | 3.116 | -1.674 | 18.243 | 15963.294*** | 41.224*** | -35.064*** |
| 巴西 | 0.053 | 12.432 | -27.055 | 2.984 | -1.299 | 9.847 | 4811.127*** | 128.240*** | -35.855*** |
| 比利时 | 0.101 | 17.226 | -40.380 | 3.430 | -2.309 | 22.669 | 24837.609*** | 85.667*** | -7.963*** |
| 德国 | 0.080 | 8.101 | -22.522 | 2.166 | -1.812 | 13.866 | 9531.783*** | 97.814*** | -19.838*** |
| 法国 | 0.203 | 16.843 | -35.495 | 3.698 | -0.995 | 9.874 | 4705.988*** | 144.685*** | -22.514*** |
| 马来西亚 | 0.033 | 10.005 | -28.161 | 2.829 | -1.773 | 14.324 | 10103.901*** | 80.551*** | -6.035*** |
| 新加坡 | 0.115 | 14.942 | -28.841 | 3.141 | -1.189 | 10.255 | 5140.368*** | 164.950*** | -20.343*** |
| 英国 | 0.079 | 6.653 | -9.793 | 1.685 | -0.398 | 3.531 | 606.560*** | 103.884*** | -30.914*** |
| 韩国 | 0.070 | 15.321 | -21.326 | 2.419 | -0.544 | 9.862 | 4564.891*** | 259.028*** | -32.323*** |
| 荷兰 | 0.037 | 12.584 | -25.781 | 2.439 | -1.589 | 16.287 | 12777.293*** | 131.888*** | -12.173*** |
| 加拿大 | 0.129 | 17.032 | -22.929 | 2.989 | -0.762 | 6.781 | 2239.672*** | 343.442*** | -8.899*** |
| 美国 | 0.051 | 12.475 | -31.778 | 3.004 | -1.657 | 14.393 | 10121.758*** | 92.526*** | -20.291*** |
| 墨西哥 | 0.097 | 12.817 | -29.091 | 2.344 | -2.487 | 27.266 | 35650.515*** | 136.850*** | -35.587*** |
| 日本 | 0.202 | 18.579 | -25.136 | 2.709 | -0.747 | 11.102 | 5819.659*** | 276.199*** | -19.777*** |
| 瑞士 | 0.056 | 13.165 | -24.263 | 2.456 | -1.499 | 13.711 | 9139.129*** | 176.794*** | -13.808*** |
| 意大利 | 0.007 | 10.472 | -29.046 | 3.274 | -1.575 | 10.610 | 5683.438*** | 79.679*** | -6.165*** |
| 印度 | 0.276 | 13.171 | -21.876 | 2.878 | -0.710 | 5.437 | 1463.906*** | 285.278*** | -21.370*** |
表2
Transformer-LSTM模型参数设置"
| 参数 | 值 | 解释 |
|---|---|---|
| Transformer注意力头大小 | 8 | 决定了每个注意力头在进行自注意力计算时的特征压缩程度 |
| Transformer注意力头数量 | 6 | 在多头注意力机制中并行的注意力头数 |
| Transformer前馈网络维度 | 8 | 在Transformer块中前馈网络的内部维度 |
| Transformer丢弃率 | 0.01 | 一种正则化技术,用于防止神经网络过拟合 |
| Transformer激活函数 | Relu | 引入非线性因素 |
| LSTM激活函数 | Tanh | — |
| 优化器 | Adam | 用于更新参数和优化目标函数 |
| 学习率 | 0.001 | 决定了神经网络能否收敛到全局最小值 |
| 损失函数 | 分位数损失函数 | — |
| Epochs | 60 | 训练所需的次数 |
| Batch_size | 20 | 定义在更新内部模型参数之前需要处理的样本数量 |
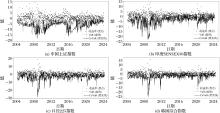
图2
中国、印度、日本、韩国股指收益率、VaR和CoVaR"


图3
基于Transformer-LSTM分位数回归模型的拟合结构图(2018年11月21日)"
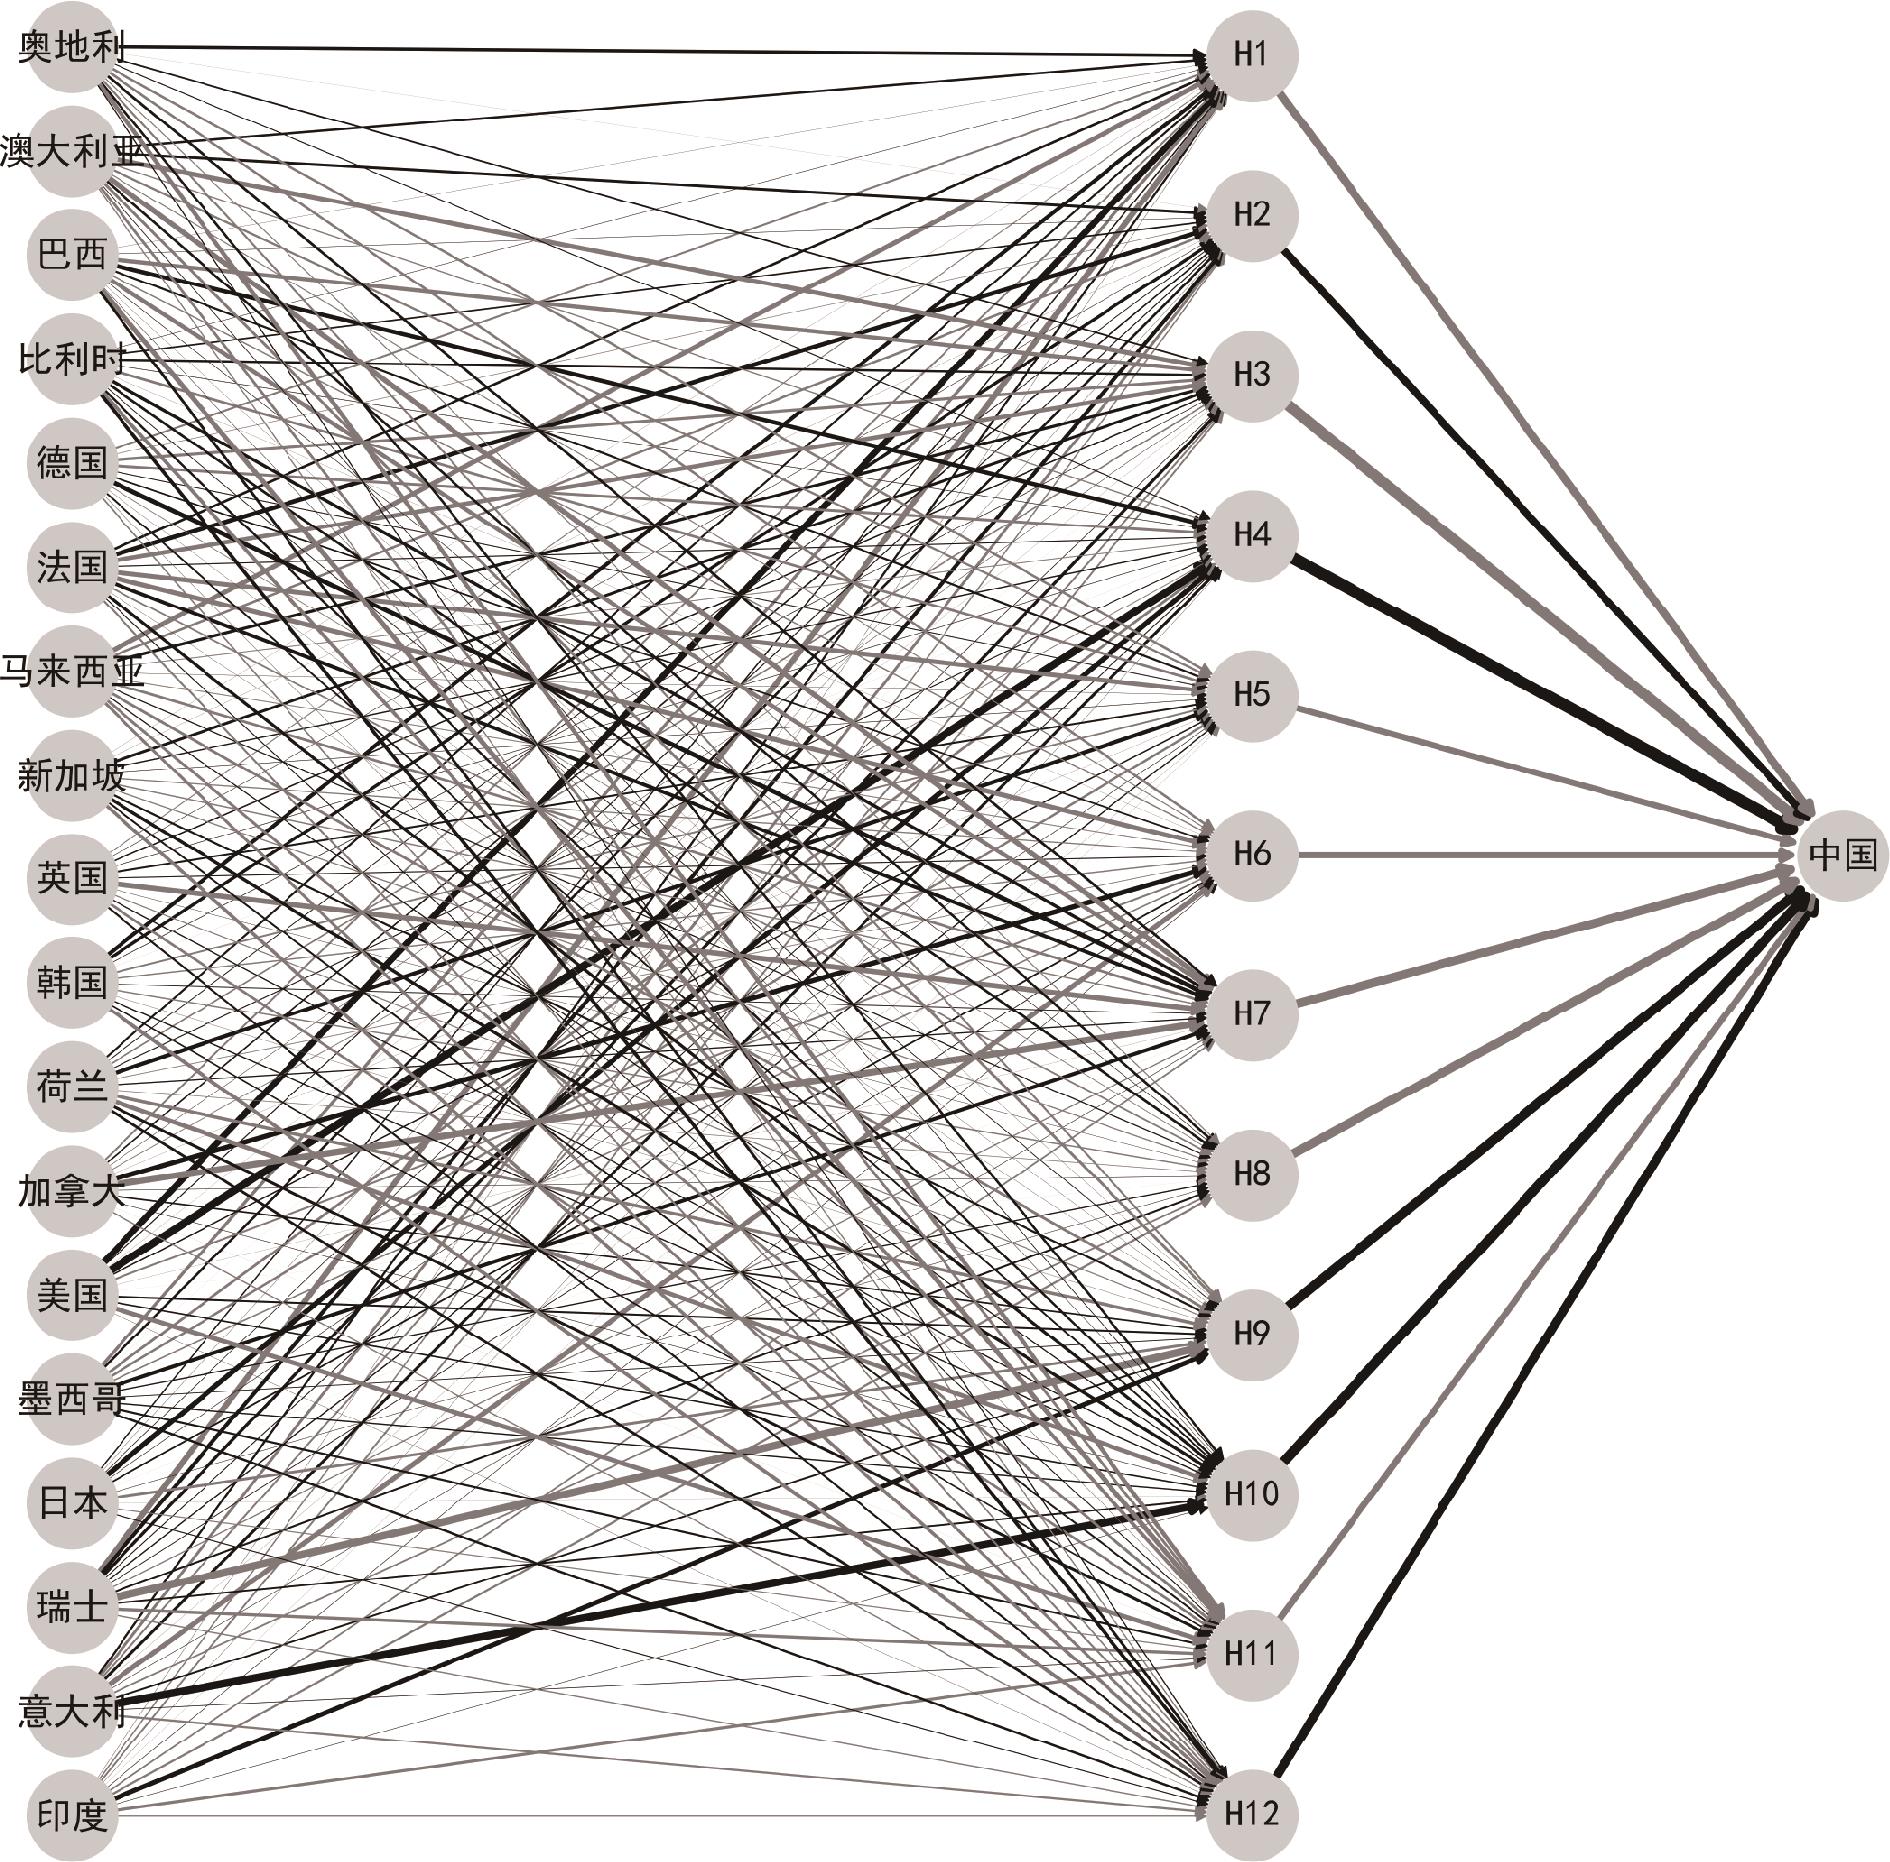
表3
Transformer-LSTM分位数回归模型相对于其他模型的DM检验结果"
| 国家 | 模型 | ||
|---|---|---|---|
| MLP | LSTM | Transformer | |
| 中国 | 2.86*** | 5.16*** | 3.72*** |
| 奥地利 | 4.47*** | 3.14*** | 5.29*** |
| 澳大利亚 | 1.76* | 1.46* | 2.89*** |
| 巴西 | 5.46*** | 3.36*** | 5.90*** |
| 比利时 | 5.18*** | 3.64*** | 5.83*** |
| 德国 | 2.57*** | 2.09** | 3.65*** |
| 法国 | 1.89* | 3.94*** | 1.42* |
| 马来西亚 | 3.90*** | 3.38*** | 4.57*** |
| 新加坡 | 4.66*** | 2.66*** | 4.54*** |
| 英国 | 2.83*** | 4.52*** | 3.04*** |
| 韩国 | 2.13*** | 2.19** | 2.15** |
| 荷兰 | 5.18*** | 3.04*** | 5.80*** |
| 加拿大 | 2.76*** | 3.91*** | 2.69*** |
| 美国 | 4.98*** | 2.83*** | 5.72*** |
| 墨西哥 | 3.87*** | 2.25** | 4.50*** |
| 日本 | 1.78** | 4.20*** | 1.91* |
| 瑞士 | 4.39*** | 1.97** | 4.36*** |
| 意大利 | 3.58*** | 3.56*** | 3.48*** |
| 印度 | 2.41** | 2.63*** | 2.14** |
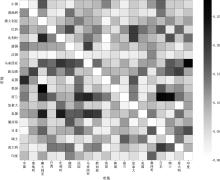
图4
全球股市极端风险溢出热力图"


图5
全球股市极端风险溢出网络"

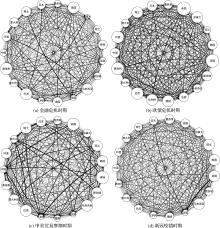
图6
危机时期全球极端风险溢出网络"

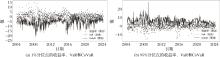
图7
中国上证指数在1%分位点和95%分位点的收益率、VaR和CoVaR"
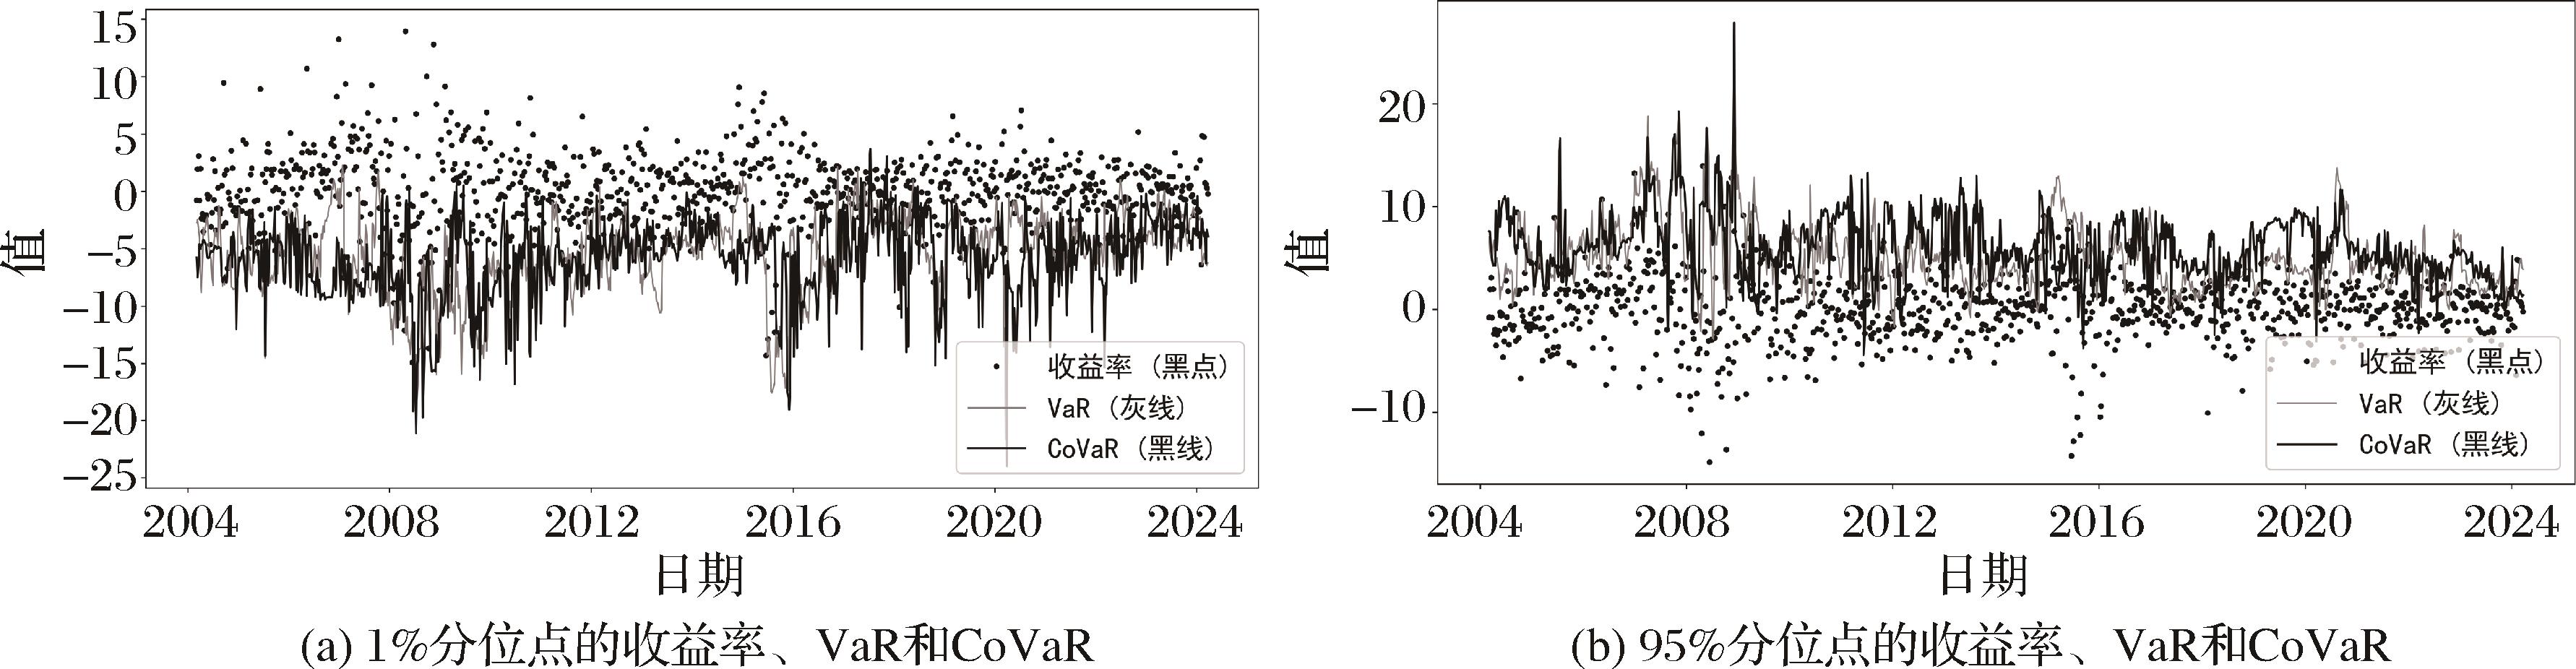
表4
滑动窗口为130周时模型的DM检验结果"
| 国家 | 模型 | ||
|---|---|---|---|
| MLP | LSTM | Transformer | |
| 中国 | 2.44** | 2.99*** | 2.45** |
| 奥地利 | 3.76*** | 2.21** | 4.35*** |
| 澳大利亚 | 2.30** | 2.14** | 2.18*** |
| 巴西 | 4.70*** | 3.84*** | 5.05*** |
| 比利时 | 4.84*** | 4.34*** | 4.71*** |
| 德国 | 2.42** | 1.66* | 3.92*** |
| 法国 | 2.53** | 2.30** | 2.17** |
| 马来西亚 | 4.45*** | 2.24** | 4.33*** |
| 新加坡 | 5.21*** | 3.24*** | 5.24*** |
| 英国 | 2.83** | 2.86*** | 2.53** |
| 韩国 | 2.78** | 3.54*** | 3.95*** |
| 荷兰 | 5.43*** | 2.42** | 4.20*** |
| 加拿大 | 2.02** | 3.11*** | 2.21** |
| 美国 | 5.75*** | 3.87*** | 5.60*** |
| 墨西哥 | 3.46*** | 2.31** | 3.39*** |
| 日本 | 1.84* | 2.63*** | 3.26** |
| 瑞士 | 5.08*** | 2.54** | 4.94*** |
| 意大利 | 3.43*** | 2.38** | 4.25*** |
| 印度 | 2.09** | 2.55** | 3.75*** |
| [1] | 王纲金, 马欣宇, 谢赤. 基于尾部风险溢出网络的全球外汇市场关联性研究[J]. 中国管理科学, 2025, 33(3): 13-23. |
| Wang G J, Ma X Y, Xie C. Measuring interconnectedness of global foreign exchange markets using tail risk spillover network[J]. Chinese Journal of Management Science, 2025, 33(3): 13-23. | |
| [2] | Cavallaro E, Villani I. Beyond financial deepening: Rethinking the finance-growth relationship in an uneven world[J]. Economic Modelling, 2022, 116: 106009. |
| [3] | 谭小芬, 虞梦微, 王欣康. 跨境资本流动的新特征、新风险及其政策建议[J]. 国际金融研究, 2023(4): 17-28. |
| Tan X F, Yu M W, Wang X K. New features, new risks and policy recommendations of cross-border capital flows[J]. Studies of International Finance, 2023(4): 17-28. | |
| [4] | 刘志峰, 张子汸, 戴鹏飞, 等. 碳市场与股票市场间的崩盘风险溢出效应研究: 新冠疫情、投资者情绪与经济政策不确定性[J]. 系统工程理论与实践, 2023,43(3): 740-754. |
| Liu Z F, Zhang Z P, Dai P F, et al. A study on the spillover effect of crash risk between carbon and stock markets: COVID-19, investor sentiment and economic policy uncertainty[J]. Systems Engineering-Theory & Practice, 2023, 43(3): 740-754. | |
| [5] | 李兆东, 曾志坚, 谢赤, 等. 多周期视角下全球股市行业间联动性与突发事件冲击影响——一个基于复杂网络的实证研究[J]. 系统工程理论与实践, 2023, 43(11): 3197-3213. |
| Li Z D, Zeng Z J, Xie C, et al. Co-movement among industries in global stock market and shocks of emergencies from a multi-periods perspective: An empirical research based on complex networks[J].Systems Engineering-Theory & Practice, 2023,43(11): 3197-3213. | |
| [6] | Ren Y, Zhao W, You W, et al. Multiscale features of extreme risk spillover networks among global stock markets[J]. The North American Journal of Economics and Finance, 2022, 62: 101754. |
| [7] | Pineda J, Cortés L M, Perote J. Financial contagion drivers during recent global crises[J]. Economic Modelling, 2022, 117: 106067. |
| [8] | Ouyang Z, Zhou X, Lai Y. Global stock markets risk contagion: Evidence from multilayer connectedness networks in the frequency domain[J]. The North American Journal of Economics and Finance, 2023, 68: 101973. |
| [9] | 朱晓谦, 李靖宇, 李建平, 等. 基于危机条件概率的系统性风险度量研究[J]. 中国管理科学, 2018, 26(6): 1-7. |
| Zhu X Q, Li J Y, Li J P, et al. An indicator of conditional probability of crisis for systemic risk measurement[J]. Chinese Journal of Management Science, 2018, 26(6): 1-7. | |
| [10] | Morgan J. RiskmetricsTM: Technical document[R]. Working Paper, Morgan Guaranty Trust Company, 1996. |
| [11] | 王江涛, 蔡雅, 郑承利. 一类自适应的风险预测算法及其应用[J]. 中国管理科学, 2023, 31(8): 1-8. |
| Wang J T, Cai Y, Zheng C L. An adaptive algorithm for prediction of risk and its application[J]. Chinese Journal of Management Science, 2023, 31(8): 1-8. | |
| [12] | Adrian T, Brunnermeier M K. CoVaR[J]. American Economic Review, 2016, 106(7): 1705-1741. |
| [13] | 叶五一, 李艾琳, 焦守坤. 基于动态模型平均的大豆期货市场风险溢出研究[J]. 中国管理科学, 2023, 31(12): 1-10. |
| Ye W Y, Li A L, Jiao S K. Risk spillover of soybean futures market based on dynamic model averaging[J]. Chinese Journal of Management Science, 2023, 31(12): 1-10. | |
| [14] | 姚海祥, 刘秋瑜, 杨晓光. 增强还是减弱:新型金融与传统金融行业之间系统性风险溢出[J]. 中国管理科学,2025,33(3):1-12. |
| Yao H X, Liu Q Y, Yang X G. Strengthening or Weakening: Systemic Risk Spillovers between Diversified Financial in Dustries and Traditional Financial Industries [J]. Chinese Journal of Management Science, 2025,33(3):1-12. | |
| [15] | Liu B Y, Fan Y, Ji Q, et al. High-dimensional CoVaR network connectedness for measuring conditional financial contagion and risk spillovers from oil markets to the G20 stock system[J]. Energy Economics, 2022, 105: 105749. |
| [16] | Wu F, Zhang Z, Zhang D, et al. Identifying systemically important financial institutions in China: New evidence from a dynamic copula-CoVaR approach[J]. Annals of Operations Research,2023,330(1): 119-153. |
| [17] | 吴金宴, 王鹏. 哪些因素影响了股市风险传染——来自行业数据的证据[J]. 中国管理科学, 2022, 30(8): 57-68. |
| Wu J Y, Wang P. Factors affecting the risk contagion of the stock market: An evidence from industry-level data[J]. Chinese Journal of Management Science, 2022, 30(8): 57-68. | |
| [18] | Girardi G, Tolga Ergün A. Systemic risk measurement: Multivariate GARCH estimation of CoVaR[J]. Journal of Banking & Finance, 2013, 37(8): 3169-3180. |
| [19] | Chen Q, Huang Z, Liang F. Measuring systemic risk with high-frequency data:A realized GARCH approach[J]. Finance Research Letters, 2023, 54: 103753. |
| [20] | Tian M, Alshater M M, Yoon S M. Dynamic risk spillovers from oil to stock markets: Fresh evidence from GARCH copula quantile regression-based CoVaR model[J]. Energy Economics, 2022, 115: 106341. |
| [21] | 侯县平, 傅春燕, 林子枭, 等. 极端风险溢出效应的定量测度及非对称性——来自中国股市与债市的经验证据[J]. 管理评论, 2020, 32(9): 55-67. |
| Hou X P, Fu C Y, Lin Z X, et al. Quantitative measurements and asymmetries of extreme risk spillover effects: Evidence from China’s stock and bond markets[J]. Management Review, 2020, 32(9): 55-67. | |
| [22] | 李竹薇, 刘森楠, 李小凤, 等. 互联网金融与传统金融之间的广义动态风险溢出——基于Copula-ARMA-GARCH-CoVaR的实证研究[J]. 系统工程, 2021, 39(4): 126-138. |
| Li Z W, Liu S N, Li X F, et al. Generalized dynamic risk spillover between Internet finance and traditional finance: An empirical study based on copula-ARMA-GARCH-CoVaR[J]. Systems Engineering, 2021, 39(4): 126-138. | |
| [23] | 任英华, 赵婉茹, 罗良清. 基于Copula函数的股票市场风险溢出网络特征研究[J]. 统计与信息论坛, 2020, 35(8): 53-63. |
| Ren Y H, Zhao W R, Luo L Q. Research on risk spillover networks among major global stock markets based on copula function[J]. Statistics & Information Forum, 2020, 35(8): 53-63. | |
| [24] | Jiang C, Li Y, Xu Q, et al. Measuring risk spillovers from multiple developed stock markets to China: A vine-copula-GARCH-MIDAS model[J]. International Review of Economics & Finance, 2021, 75: 386-398. |
| [25] | 胡毅, 李瑞, 张希, 等.基于分位数回归的系统性风险和经济增长关系研究[J].管理评论,2019, 31(12): 3-14. |
| Hu Y, Li R, Zhang X, et al. A study of the relationship between systemic risk and economic growth based on quantile regression[J]. Management Review, 2019, 31(12): 3-14. | |
| [26] | Ziadat S A, Mensi W, Al-Kharusi S, et al. Are clean energy markets hedges for stock markets A tail quantile connectedness regression[J]. Energy Economics, 2024, 136: 107757. |
| [27] | 林娟, 赵海龙. 沪深股市和香港股市的风险溢出效应研究——基于时变ΔCoVaR模型的分析[J]. 系统工程理论与实践, 2020, 40(6): 1533-1544. |
| Lin J, Zhao H L. Research on the risk spillovers between Shanghai, Shenzhen and Hong Kong stock markets: Based on the time varying ΔCoVaR model[J]. Systems Engineering-Theory & Practice, 2020, 40(6): 1533-1544. | |
| [28] | Yang L, Cui X, Yang L, et al. Risk spillover from international financial markets and China’s macro-economy: A MIDAS-CoVaR-QR model[J]. International Review of Economics & Finance, 2023, 84: 55-69. |
| [29] | 张兴敏, 傅强, 张帅, 等. 金融系统的网络结构及尾部风险度量——基于动态半参数分位数回归模型[J]. 管理评论, 2021, 33(4): 59-70. |
| Zhang X M, Fu Q, Zhang S, et al. Financial system network contagion structure and tail risk measurement based on dynamic semiparametric quantile regression model[J]. Management Review,2021,33(4): 59-70. | |
| [30] | Taylor J W. A quantile regression neural network approach to estimating the conditional density of multiperiod returns[J]. Journal of Forecasting, 2000, 19(4): 299-311. |
| [31] | 许启发, 徐金菊, 蒋翠侠, 等. 基于神经网络分位数回归的VaR金融风险测度[J]. 合肥工业大学学报(自然科学版), 2014, 37(12): 1518-1522. |
| Xu Q F, Xu J J, Jiang C X, et al. Financial risk measure of VaR based on quantile regression neural network[J]. Journal of Hefei University of Technology (Natural Science), 2014, 37(12): 1518-1522. | |
| [32] | Naeem M A, Karim S, Tiwari A K. Quantifying systemic risk in US industries using neural network quantile regression[J]. Research in International Business and Finance, 2022, 61: 101648. |
| [33] | Naeem M A, Karim S, Yarovaya L, et al. Systemic risk contagion of green and Islamic markets with conventional markets[J]. Annals of Operations Research, 2025,347: 265-287. |
| [34] | Keilbar G, Wang W. Modelling systemic risk using neural network quantile regression[J]. Empirical Economics, 2022, 62(1): 93-118. |
| [35] | Aprea I L, Scognamiglio S, Zanetti P. Systemic risk measurement: A Quantile Long Short-Term Memory network approach[J]. Applied Soft Computing, 2024, 152: 111224. |
| [36] | Christoffersen P. Value-at-risk models[M]//Handbook of Financial Time Series. Berlin, Heidelberg: Springer Berlin Heidelberg, 2009: 753-766. |
| [37] | 张伟平, 庄新田, 王健. 中国股市跨行业系统性风险空间溢出关联及风险预测分析——基于尾部风险网络模型[J]. 中国管理科学, 2021, 29(12): 15-28. |
| Zhang W P, Zhuang X T, Wang J. Systematic risk spatial spillover correlation and risk prediction analysis of cross-industry in China’ stock market: Based on the tail risk network model[J]. Chinese Journal of Management Science, 2021, 29(12): 15-28. | |
| [38] | Engle R F, Manganelli S. CAViaR: Conditional autoregressive value at risk by regression quantiles[J]. Journal of Business & Economic Statistics, 2004, 22(4): 367-381. |
| [39] | Koenker R, Bassett G J. Regression quantiles[J]. Econometrica: Journal of the Econometric Society, 1978,46(1): 33-50. |
| [40] | Vaswani A, Shazeer N, Parmar N, et al. Attention is all you need[C]//Proceedings of the 31st International Conference on Neural Information Processing Systems (NIPS'17), NY, USA, December 4-9 , Curran Associates Inc., Red Hook, 2017: 6000-6010. |
| [41] | Hochreiter S, Schmidhuber J. Long short-term memory[J]. Neural Computation, 1997, 9(8): 1735-1780. |
| [42] | Diebold F X, Mariano R S. Comparing predictive accuracy[J]. Journal of Business & Economic Statistics, 1995, 13(3): 253-263. |
| [43] | Diebold F X, Yilmaz K. Measuring financial asset return and volatility spillovers, with application to global equity markets[J]. The Economic Journal, 2009, 119(534): 158-171. |
| [44] | 荆中博, 胡佳楠, 方意. 宏观金融波动与中国银行业系统性风险: 金融周期视角[J]. 系统工程理论与实践, 2023, 43(7): 1940-1959. |
| Jing Z B, Hu J N, Fang Y. Macro financial fluctuation and China’s banking systemic risk: A financial cycle perspective[J]. Systems Engineering-Theory & Practice, 2023, 43(7): 1940-1959. | |
| [45] | 赵万里, 范英, 姬强, 等. “一带一路” 国家金融风险溢出研究——基于TENET网络方法[J]. 系统工程理论与实践, 2022, 42(1): 24-36. |
| Zhao W L, Fan Y, Ji Q, et al. Research on financial risk spillover of the countries along the Belt and Road: Based on TENET method[J]. Systems Engineering-Theory & Practice, 2022, 42(1): 24-36. | |
| [46] | Wang C, Chen Y, Zhang S, et al. Stock market index prediction using deep Transformer model[J]. Expert Systems with Applications, 2022, 208: 118128. |
| [47] | 张雪彤, 张卫国, 王超. 发达市场与新兴市场的尾部风险——溢出、传染与传染动因检验[J]. 中国管理科学, 2024, 32(4): 14-25. |
| Zhang X T, Zhang W G, Wang C. Tail risks in developed and emerging markets: Test of spillover, contagion and contagion determinants[J]. Chinese Journal of Management Science, 2024, 32(4): 14-25. | |
| [48] | 钟婉玲, 李海奇. 股市互联与尾部风险溢出效应研究[J]. 计量经济学报, 2024, 4(2): 467-486. |
| Zhong W L, Li H Q. Stock market interconnection and tail risk spillover effects[J]. China Journal of Econometrics, 2024, 4(2): 467-486. | |
| [49] | 杨子晖, 王姝黛. 突发公共卫生事件下的全球股市系统性金融风险传染——来自新冠疫情的证据[J]. 经济研究, 2021, 56(8): 22-38. |
| Yang Z H, Wang S D. Systemic financial risk contagion of global stock market under public health emergency: Empirical evidence from COVID19 epidemic[J].Economic Research Journal, 2021,56(8): 22-38. |
| [1] | 杨科, 刘鑫, 田凤平. 中国与其他主要新兴市场国家间股市极端风险的跨市场传染[J]. 中国管理科学, 2025, 33(7): 44-53. |
| [2] | 汪刘凯, 张小波, 王未卿, 刘澄. 基于MIDAS-SVQR的供应链金融质押物风险价值测度新方法[J]. 中国管理科学, 2025, 33(3): 80-92. |
| [3] | 严雨婷,毕文杰. 基于XGBoost算法的数据驱动单周期报童问题研究[J]. 中国管理科学, 2024, 32(1): 260-267. |
| [4] | 王江涛,蔡雅,郑承利. 一类自适应的风险预测算法及其应用[J]. 中国管理科学, 2023, 31(8): 1-8. |
| [5] | 叶五一,李艾琳,焦守坤. 基于动态模型平均的大豆期货市场风险溢出研究[J]. 中国管理科学, 2023, 31(12): 1-10. |
| [6] | 赵为华, 王玲, 程喆, 张日权. 比例数据基于Tobit分位数回归模型的贝叶斯变量选择[J]. 中国管理科学, 2022, 30(4): 63-73. |
| [7] | 欧阳资生, 杨希特, 黄颖. 嵌入网络舆情指数的中国金融机构系统性风险传染效应研究[J]. 中国管理科学, 2022, 30(4): 1-12. |
| [8] | 王小燕, 袁腾, 段湘斌. 基于零膨胀分位数两部模型的银行贷款违约预测研究[J]. 中国管理科学, 2022, 30(10): 1-13. |
| [9] | 许启发, 刘书婷, 蒋翠侠. 基于MIDAS分位数回归的条件偏度组合投资决策[J]. 中国管理科学, 2021, 29(3): 24-36. |
| [10] | 刘映琳, 刘永辉, 鞠卓. 国际原油价格波动对中国商品期货的影响——基于多重相关性结构断点的分析[J]. 中国管理科学, 2019, 27(2): 31-40. |
| [11] | 许启发, 李辉艳, 蒋翠侠. 基于Copula-分位数回归的供应链金融多期贷款组合优化[J]. 中国管理科学, 2017, 25(6): 50-60. |
| [12] | 许启发, 周莹莹, 蒋翠侠. 带有范数约束的CVaR高维组合投资决策[J]. 中国管理科学, 2017, 25(2): 40-49. |
| [13] | 陈九生, 周孝华. 基于单因子MSV-CoVaR模型的金融市场风险溢出度量研究[J]. 中国管理科学, 2017, 25(1): 21-26. |
| [14] | 许启发, 蔡超, 蒋翠侠. 指令不均衡与股票收益关系研究——基于大规模数据分位数回归的实证[J]. 中国管理科学, 2016, 24(12): 20-29. |
| [15] | 解其昌. 稳健非参数VaR建模及风险量化研究[J]. 中国管理科学, 2015, 23(8): 29-38. |
| 阅读次数 | ||||||
|
全文 |
|
|||||
|
摘要 |
|
|||||
|
||