主管:中国科学院
主办:中国优选法统筹法与经济数学研究会
中国科学院科技战略咨询研究院
主办:中国优选法统筹法与经济数学研究会
中国科学院科技战略咨询研究院
Chinese Journal of Management Science ›› 2026, Vol. 34 ›› Issue (7): 33-48.doi: 10.16381/j.cnki.issn1003-207x.2023.1100
Previous Articles Next Articles
Xinyu Song1, Yuanyuan Deng1, Yong Zhou2, Huiling Yuan3( )
)
Received:2023-06-29
Revised:2024-09-14
Online:2026-07-25
Published:2026-06-18
Contact:
Huiling Yuan
E-mail:yuanhuiling2016@gmail.com
CLC Number:
Xinyu Song,Yuanyuan Deng,Yong Zhou, et al. Multivariate GARCH-It
"
| 模型参数估计 | ||||||
|---|---|---|---|---|---|---|
| 240 | 0.237 | 0.164 | 0.132 | 0.486 | 0.339 | 0.803 |
| 480 | 0.185 | 0.135 | 0.115 | 0.353 | 0.227 | 0.517 |
| 1440 | 0.127 | 0.107 | 0.089 | 0.253 | 0.166 | 0.300 |
| 14400 | 0.052 | 0.058 | 0.045 | 0.139 | 0.092 | 0.123 |
| 240 | 3.942 | 9.219 | 8.082 | 2.198 | 5.257 | 12.368 |
| 480 | 3.328 | 7.392 | 6.537 | 1.623 | 3.493 | 8.350 |
| 1440 | 2.579 | 5.472 | 4.703 | 0.996 | 2.089 | 5.161 |
| 14400 | 1.494 | 3.164 | 2.582 | 0.514 | 0.893 | 2.242 |
| 240 | 2.892 | 4.948 | 3.846 | 1.954 | 1.849 | 4.437 |
| 480 | 2.230 | 4.098 | 3.259 | 1.549 | 1.471 | 2.945 |
| 1440 | 1.493 | 3.050 | 2.287 | 1.165 | 1.139 | 2.106 |
| 14400 | 0.869 | 1.770 | 1.352 | 0.686 | 0.602 | 1.001 |
| 240 | 1.043 | 2.197 | 2.577 | |||
| 480 | 0.823 | 1.820 | 2.258 | |||
| 1440 | 0.626 | 1.441 | 1.730 | |||
| 14400 | 0.332 | 0.780 | 0.921 | |||
"
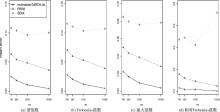
| 范数 | 多元GARCH-It | PRVM方法 | BEKK模型 | |
|---|---|---|---|---|
| 谱范数 | 240 | 2.486 | 6.365 | 10.866 |
| 480 | 1.824 | 5.432 | 10.414 | |
| 1440 | 1.078 | 4.859 | 9.645 | |
| 14400 | 0.434 | 3.615 | 10.047 | |
Frobenius 范数 | 240 | 2.766 | 7.065 | 11.602 |
| 480 | 2.037 | 6.004 | 11.109 | |
| 1440 | 1.186 | 5.329 | 10.355 | |
| 14400 | 0.466 | 3.931 | 10.745 | |
| 最大范数 | 240 | 2.240 | 5.033 | 8.520 |
| 480 | 1.651 | 4.335 | 7.984 | |
| 1440 | 0.941 | 3.872 | 7.627 | |
| 14400 | 0.358 | 2.838 | 7.850 | |
相对Frobenius 范数 | 240 | 2.955 | 15.587 | 47.287 |
| 480 | 1.500 | 11.985 | 48.994 | |
| 1440 | 1.480 | 8.904 | 42.427 | |
| 14400 | 0.054 | 4.826 | 71.902 |
"
"
| 模型参数估计 | ||||||
|---|---|---|---|---|---|---|
| 240 | 0.243 | 0.228 | 0.222 | 0.822 | 0.57 | 0.629 |
| 480 | 0.215 | 0.193 | 0.167 | 0.664 | 0.433 | 0.543 |
| 1440 | 0.203 | 0.140 | 0.127 | 0.494 | 0.345 | 0.447 |
| 8640 | 0.198 | 0.087 | 0.073 | 0.293 | 0.219 | 0.324 |
| 240 | 7.157 | 11.873 | 12.552 | 4.339 | 5.983 | 16.327 |
| 480 | 5.847 | 9.094 | 9.321 | 2.982 | 4.941 | 13.521 |
| 1440 | 4.278 | 6.803 | 7.095 | 2.095 | 3.675 | 9.150 |
| 8640 | 2.526 | 4.174 | 4.039 | 1.137 | 2.204 | 4.935 |
| 240 | 3.061 | 5.537 | 4.067 | 2.583 | 2.046 | 4.086 |
| 480 | 2.537 | 4.221 | 3.331 | 2.060 | 1.870 | 3.507 |
| 1440 | 1.905 | 3.314 | 2.757 | 1.637 | 1.386 | 2.338 |
| 8640 | 1.110 | 2.161 | 1.710 | 0.923 | 0.951 | 1.415 |
| 240 | 1.124 | 2.348 | 2.948 | |||
| 480 | 0.973 | 1.801 | 2.620 | |||
| 1440 | 0.714 | 1.534 | 1.993 | |||
| 8640 | 0.450 | 0.979 | 1.275 | |||
"

"
| 范数 | 多元GARCH-It | 因子GARCH-It | POET方法 | PRVM模型 | SV-It | |
|---|---|---|---|---|---|---|
| 谱范数 | 240 | 2.040 | 8.111 | 7.300 | 7.300 | 3.277 |
| 480 | 1.628 | 7.683 | 6.634 | 6.634 | 2.434 | |
| 1440 | 0.991 | 6.154 | 5.262 | 5.258 | 1.986 | |
| 8640 | 0.600 | 6.021 | 4.389 | 4.381 | 1.548 | |
| Frobenius范数 | 240 | 2.333 | 9.598 | 8.786 | 8.937 | 3.504 |
| 480 | 1.929 | 8.850 | 7.842 | 7.965 | 2.874 | |
| 1440 | 1.340 | 7.063 | 6.259 | 6.334 | 2.478 | |
| 8640 | 1.023 | 6.604 | 5.079 | 5.073 | 2.172 | |
| 最大范数 | 240 | 0.096 | 0.366 | 0.331 | 0.338 | 0.148 |
| 480 | 0.085 | 0.332 | 0.292 | 0.302 | 0.135 | |
| 1440 | 0.066 | 0.261 | 0.232 | 0.239 | 0.115 | |
| 8640 | 0.054 | 0.234 | 0.182 | 0.190 | 0.101 | |
| 相对Frobenius范数 | 240 | 0.534 | 1.571 | 1.345 | 5.297 | 0.685 |
| 480 | 0.642 | 1.213 | 1.103 | 3.821 | 0.756 | |
| 1440 | 0.808 | 1.048 | 1.015 | 2.251 | 0.811 | |
| 8640 | 0.941 | 1.014 | 1.006 | 0.935 | 0.968 |
"

"
| 参数 | 预测区间 | 多元GARCH-It | 因子 GARCH-It | POET | PRVM | SV-It | ||||
|---|---|---|---|---|---|---|---|---|---|---|
| 2020年1月 | 0.317 | 0.322 | 0.319 | 0.317 | 0.327 | 0.379 | 0.372 | 0.372 | 0.325 | |
| 2020年2月 | 0.435 | 0.45 | 0.451 | 0.451 | 0.461 | 0.399 | 0.408 | 0.411 | 0.431 | |
| 2020年3月 | 0.369 | 0.404 | 0.400 | 0.401 | 0.409 | 0.398 | 0.443 | 0.443 | 0.410 | |
| 2020年4月 | 0.242 | 0.248 | 0.247 | 0.246 | 0.25 | 0.286 | 0.277 | 0.277 | 0.251 | |
| 2020年5月 | 0.219 | 0.234 | 0.220 | 0.221 | 0.228 | 0.295 | 0.295 | 0.295 | 0.234 | |
| 2020年6月 | 0.255 | 0.253 | 0.260 | 0.261 | 0.265 | 0.319 | 0.291 | 0.291 | 0.270 | |
| 2020年7月 | 0.544 | 0.557 | 0.569 | 0.569 | 0.572 | 0.589 | 0.591 | 0.591 | 0.570 | |
| 2020年8月 | 0.448 | 0.453 | 0.459 | 0.458 | 0.46 | 0.374 | 0.382 | 0.383 | 0.465 | |
| 2020年9月 | 0.309 | 0.313 | 0.321 | 0.318 | 0.322 | 0.369 | 0.367 | 0.366 | 0.330 | |
| 2020年10月 | 0.295 | 0.300 | 0.301 | 0.301 | 0.302 | 0.356 | 0.353 | 0.354 | 0.312 | |
| 2020年11月 | 0.272 | 0.278 | 0.278 | 0.279 | 0.277 | 0.268 | 0.257 | 0.257 | 0.270 | |
| 2020年12月 | 0.291 | 0.295 | 0.300 | 0.300 | 0.296 | 0.319 | 0.311 | 0.312 | 0.305 | |
| 2020年1月 | 2683637 | 2683650 | 2683670 | 2683662 | 2683663 | 14278552 | 13865714 | 4536163 | 3196557 | |
| 2020年2月 | 1215402 | 1215431 | 1215449 | 1215465 | 1215465 | 8825641 | 7775543 | 1995877 | 1723084 | |
| 2020年3月 | 1350027 | 1350036 | 1350031 | 1350036 | 1350037 | 6090200 | 5967906 | 2067773 | 1873059 | |
| 2020年4月 | 1531613 | 1531630 | 1531631 | 1531646 | 1531659 | 17445132 | 17749757 | 2439849 | 2194860 | |
| 2020年5月 | 1444130 | 1444160 | 1444179 | 1444199 | 1444193 | 7510691 | 7573684 | 2175766 | 1906547 | |
| 2020年6月 | 2240633 | 2240623 | 2240613 | 2240609 | 2240618 | 10843838 | 11009881 | 3713105 | 2629829 | |
| 2020年7月 | 1784926 | 1784974 | 1784984 | 1785051 | 1785057 | 6197296 | 6182715 | 3279139 | 2328066 | |
| 2020年8月 | 2146406 | 2146426 | 2146437 | 2146448 | 2146456 | 11184674 | 11467610 | 3715848 | 2695563 | |
| 2020年9月 | 1256194 | 1256199 | 1256195 | 1256211 | 1256212 | 30121488 | 29998299 | 1988675 | 1819442 | |
| 2020年10月 | 1728144 | 1728168 | 1728177 | 1728218 | 1728212 | 16069270 | 16447190 | 2654057 | 2269224 | |
| 2020年11月 | 2452643 | 2452663 | 2452670 | 2452678 | 2452692 | 27518090 | 128795320 | 4056123 | 2904073 | |
| 2020年12月 | 1473267 | 1473286 | 1473290 | 1473300 | 1473305 | 15853939 | 16214797 | 2187645 | 1956125 | |
"
| 预测误差方差 | 预测区间 | 多元GARCH-It | 因子GARCH-It | POET | PRVM | SV-It | ||||
|---|---|---|---|---|---|---|---|---|---|---|
预测误差 方差 | 2020年1月 | 0.358 | 0.344 | 0.318 | 0.326 | 0.273 | 0.344 | 0.325 | 0.325 | 0.323 |
| 2020年2月 | 0.469 | 0.351 | 0.321 | 0.328 | 0.278 | 0.576 | 0.657 | 0.657 | 0.326 | |
| 2020年3月 | 0.544 | 0.353 | 0.323 | 0.323 | 0.279 | 0.576 | 0.68 | 0.68 | 0.327 | |
| 2020年4月 | 0.397 | 0.347 | 0.321 | 0.317 | 0.286 | 0.367 | 0.344 | 0.344 | 0.325 | |
| 2020年5月 | 0.378 | 0.347 | 0.319 | 0.315 | 0.29 | 0.328 | 0.292 | 0.292 | 0.323 | |
| 2020年6月 | 0.363 | 0.348 | 0.316 | 0.313 | 0.284 | 0.333 | 0.285 | 0.285 | 0.317 | |
| 2020年7月 | 0.558 | 0.368 | 0.317 | 0.313 | 0.29 | 0.738 | 0.814 | 0.814 | 0.319 | |
| 2020年8月 | 0.43 | 0.356 | 0.322 | 0.318 | 0.296 | 0.48 | 0.504 | 0.504 | 0.328 | |
| 2020年9月 | 0.405 | 0.357 | 0.321 | 0.317 | 0.303 | 0.374 | 0.364 | 0.364 | 0.327 | |
| 2020年10月 | 0.379 | 0.357 | 0.32 | 0.316 | 0.306 | 0.356 | 0.325 | 0.325 | 0.327 | |
| 2020年11月 | 0.38 | 0.356 | 0.32 | 0.315 | 0.31 | 0.438 | 0.416 | 0.416 | 0.324 | |
| 2020年12月 | 0.379 | 0.356 | 0.32 | 0.314 | 0.318 | 0.387 | 0.377 | 0.377 | 0.330 | |
"

"
| 预测区间 | 多元GARCH-It | 因子GARCH- It | POET | PRVM | SV-It | ||||
|---|---|---|---|---|---|---|---|---|---|
| 2020年1月 | 0.107 | 0.093 | 0.08 | 0.084 | 0.088 | 0.861 | 0.862 | 0.61 | 0.326 |
| 2020年2月 | 0.14 | 0.145 | 0.129 | 0.142 | 0.156 | 0.801 | 0.782 | 0.944 | 0.404 |
| 2020年3月 | 0.169 | 0.177 | 0.179 | 0.203 | 0.221 | 1.337 | 1.343 | 0.245 | 0.381 |
| 2020年4月 | 0.125 | 0.109 | 0.087 | 0.095 | 0.096 | 1.072 | 1.074 | 0.259 | 0.379 |
| 2020年5月 | 0.122 | 0.114 | 0.079 | 0.081 | 0.085 | 0.554 | 0.552 | 0.156 | 0.328 |
| 2020年6月 | 0.123 | 0.101 | 0.077 | 0.085 | 0.081 | 0.985 | 0.981 | 0.23 | 0.310 |
| 2020年7月 | 0.167 | 0.19 | 0.177 | 0.223 | 0.207 | 1.59 | 1.589 | 0.393 | 0.428 |
| 2020年8月 | 0.135 | 0.151 | 0.135 | 0.153 | 0.148 | 1.271 | 1.273 | 0.337 | 0.471 |
| 2020年9月 | 0.133 | 0.117 | 0.111 | 0.129 | 0.118 | 1.076 | 1.077 | 0.284 | 0.490 |
| 2020年10月 | 0.12 | 0.096 | 0.093 | 0.108 | 0.095 | 0.84 | 0.838 | 0.68 | 0.408 |
| 2020年11月 | 0.124 | 0.109 | 0.095 | 0.096 | 0.102 | 0.867 | 0.867 | 0.192 | 0.346 |
| 2020年12月 | 0.128 | 0.093 | 0.088 | 0.092 | 0.093 | 0.991 | 0.995 | 0.316 | 0.362 |
| [1] | Engle R F. Autoregressive conditional heteroscedasticity with estimates of the variance of United Kingdom inflation[J]. Econometrica, 1982, 50(4): 987. |
| [2] | Bollerslev T. Generalized autoregressive conditional heteroskedasticity[J]. Journal of Econometrics, 1986, 31(3): 307-327. |
| [3] | Zhang L, Mykland P A, Aït-Sahalia Y. A tale of two time scales: Determining integrated volatility with noisy high-frequency data[J]. Journal of the American Statistical Association, 2005, 100(472): 1394-1411. |
| [4] | Zhang L. Efficient estimation of stochastic volatility using noisy observations: A multi-scale approach[J]. Bernoulli, 2006, 12(6): 1019-1043. |
| [5] | Zhang L. Estimating covariation: Epps effect, microstructure noise[J]. Journal of Econometrics, 2011, 160(1): 33-47. |
| [6] | Barndorff-Nielsen O E, Hansen P R, Lunde A, et al. Designing realised kernels to measure the ex-post variation of equity prices in the presence of noise[J]. SSRN Electronic Journal, 2008,76: 1481-1536. |
| [7] | Barndorff-Nielsen O E, Hansen P R, Lunde A, et al. Multivariate realised kernels: Consistent positive semi-definite estimators of the covariation of equity prices with noise and non-synchronous trading[J]. Journal of Econometrics, 2011, 162(2): 149-169. |
| [8] | Jacod J, Li Y, Mykland P A, et al. Microstructure noise in the continuous case: The pre-averaging approach[J]. Stochastic Processes and Their Applications, 2009, 119(7): 2249-2276. |
| [9] | Christensen K, Kinnebrock S, Podolskij M. Pre-averaging estimators of the ex-post covariance matrix in noisy diffusion models with non-synchronous data[J]. Journal of Econometrics, 2010, 159(1): 116-133. |
| [10] | Aït-Sahalia Y, Fan J, Xiu D. High-frequency covariance estimates with noisy and asynchronous financial data[J]. Journal of the American Statistical Association, 2010, 105(492): 1504-1517. |
| [11] | Xiu D. Quasi-maximum likelihood estimation of volatility with high frequency data[J]. Journal of Econometrics, 2010, 159(1): 235-250. |
| [12] | Ghysels E, Santa-Clara P, Valkanov R. Predicting volatility: Getting the most out of return data sampled at different frequencies[J]. Journal of Econometrics, 2006, 131(1-2): 59-95. |
| [13] | Engle R F, Gallo G M. A multiple indicators model for volatility using intra-daily data[J]. Journal of Econometrics, 2006, 131(1-2): 3-27. |
| [14] | Corsi F. A simple approximate long-memory model of realized volatility[J]. Journal of Financial Econometrics, 2009, 7(2): 174-196. |
| [15] | Shephard N, Sheppard K. Realising the future: Forecasting with high-frequency-based volatility (HEAVY) models[J]. Journal of Applied Econometrics, 2010, 25(2): 197-231. |
| [16] | Hansen P R, Huang Z, Shek H H. Realized GARCH: A joint model for returns and realized measures of volatility[J]. Journal of Applied Econometrics, 2012, 27(6): 877-906. |
| [17] | Kim D, Wang Y. Unified discrete-time and continuous-time models and statistical inferences for merged low-frequency and high-frequency financial data[J]. Journal of Econometrics, 2016, 194(2): 220-230. |
| [18] | Song X Y, Kim D, Yuan H L, et al. Volatility analysis with realized GARCH-Itô models[J]. Journal of Econometrics, 2021, 222(1): 393-410. |
| [19] | Yuan H L, Zhou Y, Zhang Z Y, et al. Volatility analysis for the GARCH-Itô model with option data[J]. Canadian Journal of Statistics, 2024, 52(1): 237-270. |
| [20] | Yuan H L, Lu K X, Li G D. Volatility analysis with high-frequency and low-frequency historical data, and options-implied information[J]. Statistica Sinica, 2025, 35: 2305-2323. |
| [21] | Wang Y, Zou J. Vast volatility matrix estimation for high-frequency financial data[J]. The Annals of Statistics, 2010, 38(2): 943-978. |
| [22] | Tao M, Wang Y, Chen X. Fast convergence rates in estimating large volatility matrices using high-frequency financial data[J]. Econometric Theory, 2013, 29(4): 838-856. |
| [23] | Cai T, Liu W. Adaptive thresholding for sparse covariance matrix estimation[J]. Journal of the American Statistical Association, 2011, 106(494): 672-684. |
| [24] | Kim D, Wang Y, Zou J. Asymptotic theory for large volatility matrix estimation based on high-frequency financial data[J]. Stochastic Processes and Their Applications, 2016, 126(11): 3527-3577. |
| [25] | 穆燕, 苑慧玲, 周勇. 高频金融数据的高维积分波动率矩阵估计[J].中国科学:数学,2018,48(2): 319-344. |
| Mu Y, Yuan H L, Zhou Y. High-dimensional integrated volatility matrix estimation for high-frequency financial data[J]. Scientia Sinica (Mathematica), 2018, 48(2): 319-344. | |
| [26] | 穆燕, 周勇. 带跳高频数据下高维积分波动率矩阵估计[J]. 中国科学: 数学, 2020, 50(10): 1455-1486. |
| Mu Y, Zhou Y. High-dimensional integrated volatility matrix estimation for high-frequency financial data with jumps[J]. Scientia Sinica (Mathematica), 2020, 50(10): 1455-1486. | |
| [27] | Fan J, Fan Y, Lv J. High dimensional covariance matrix estimation using a factor model[J]. Journal of Econometrics, 2008, 147(1): 186-197. |
| [28] | Fan J Q, Liao Y, Mincheva M. Large covariance estimation by thresholding principal orthogonal complements[J]. Journal of the Royal Statistical Society Series B: Statistical Methodology, 2013, 75(4): 603-680. |
| [29] | Aït-Sahalia Y, Xiu D C. Using principal component analysis to estimate a high dimensional factor model with high-frequency data[J]. Journal of Econometrics, 2017, 201(2): 384-399. |
| [30] | Fan J Q, Furger A, Xiu D C. Incorporating global industrial classification standard into portfolio allocation: A simple factor-based large covariance matrix estimator with high-frequency data[J]. Journal of Business & Economic Statistics, 2016, 34(4): 489-503. |
| [31] | Dai C, Lu K, Xiu D C. Knowing factors or factor loadings, or neither? Evaluating estimators of large covariance matrices with noisy and asynchronous data[J]. Journal of Econometrics, 2019, 208(1): 43-79. |
| [32] | Kim D, Fan J. Factor GARCH-Itô models for high-frequency data with application to large volatility matrix prediction[J]. Journal of Econometrics, 2019, 208(2): 395-417. |
| [33] | Aït-Sahalia Y, Kalnina I, Xiu D C. High-frequency factor models and regressions[J]. Journal of Econometrics, 2020, 216(1): 86-105. |
| [34] | Fan J Q, Ke Y, Wang K. Factor-adjusted regularized model selection[J]. Journal of Econometrics, 2020, 216(1): 71-85. |
| [35] | Engle R F, Kroner K F. Multivariate simultaneous generalized ARCH[J]. Econometric Theory, 1995, 11(1): 122-150. |
| [36] | Bollerslev T, Engle R F, Wooldridge J M. A capital asset pricing model with time-varying covariances[J]. Journal of Political Economy, 1988, 96(1): 116-131. |
| [37] | Aït-Sahalia Y, Yu J L. High frequency market microstructure noise estimates and liquidity measures[J]. The Annals of Applied Statistics, 2009, 3(1): 422-457. |
| [38] | Aït-Sahalia Y, Xiu D. A Hausman test for the presence of market microstructure noise in high frequency data[J]. Journal of Econometrics, 2019, 211(1): 176-205. |
| [39] | Kim D. Statistical inference for unified garch–itô models with high-frequency financial data[J]. Journal of Time Series Analysis, 2016, 37(4): 513-532. |
| [40] | Kim D, Liu Y, Wang Y. Large volatility matrix estimation with factor-based diffusion model for high-frequency financial data[J]. Bernoulli, 2018, 24(4B): 3657-3682. |
| [41] | Kim D, Song X Y, Wang Y. Unified discrete-time factor stochastic volatility and continuous-time Itô models for combining inference based on low-frequency and high-frequency[J]. Journal of Multivariate Analysis, 2022, 192: 105091. |
| [42] | Candès E J, Li X, Ma Y W, et al. Robust principal component analysis?[J]. Journal of the ACM, 2011, 58(3): 1-37. |
| [43] | Fan J Q, Wang W C, Zhong Y Q. An l ∞ Eigenvector Perturbation Bound and Its Application to Robust Covariance Estimation [J]. Journal of Machine Learning Resarch, 2018, 18: 1-42. |
| [44] | Fan J Q, Kim D. Robust high-dimensional volatility matrix estimation for high-frequency factor model[J]. Journal of the American Statistical Association, 2018, 113(523): 1268-1283. |
| [45] | Tao M J, Wang Y Z, Zhou H H. Optimal sparse volatility matrix estimation for high-dimensional Itô processes with measurement errors[J]. The Annals of Statistics, 2013, 41(4): 1816-1864. |
| [46] | Wang Y Z, Zou J. Volatility analysis in high-frequency financial data[J]. WIREs Computational Statistics, 2014, 6(6): 393-404. |
| [47] | Cai T T, Hu J C, Li Y Y, et al. High-dimensional minimum variance portfolio estimation based on high-frequency data[J]. Journal of Econometrics, 2020, 214(2): 482-494. |
| [48] | Engle R. Dynamic conditional correlation: A simple class of multivariate generalized autoregressive conditional heteroskedasticity models[J]. Journal of Business & Economic Statistics, 2002, 20(3): 339-350. |
| [49] | Dhaene G, Wu J. Incorporating overnight and intraday returns into multivariate GARCH volatility models[J]. Journal of Econometrics, 2020, 217(2): 471-495. |
| [50] | Linton O, Wu J. A coupled component DCS-EGARCH model for intraday and overnight volatility[J]. Journal of Econometrics, 2020, 217(1): 176-201. |
| [51] | Kim D, Shin M, Wang Y Z. Overnight GARCH-itô volatility models[J]. Journal of Business & Economic Statistics, 2023, 41(4): 1215-1227. |
| [1] | Xuanming Ni,Tiantian Zheng,Huimin Zhao,Kangping Wu. Asset Pricing Based on the Optimal Idiosyncratic Return Factor [J]. Chinese Journal of Management Science, 2024, 32(8): 50-60. |
| [2] | Guang-lin HUANG,Wan-bo LU. High Dimensional Dynamic Higher-order Portfolio Selection Based on the Varying-coefficient Multi-factor Semi-nonparametric Distribution Model [J]. Chinese Journal of Management Science, 2023, 31(12): 272-280. |
| [3] | LIANG Chao, WEI Yu, MA Feng, LI Xia-fei. Forecasting Volatility of China Gold Futures Price: New Evidence from Model Shrinkage Methods [J]. Chinese Journal of Management Science, 2022, 30(4): 30-41. |
| [4] | WU Xin-yu, LI Xin-dan, MA Chao-qun. Measuring VaR Based on the Information Content of Option and High-frequency Data [J]. Chinese Journal of Management Science, 2021, 29(8): 13-23. |
| [5] | QU Hui, ZHANG Yi. The Study of High-dimensional Volatility Estimators and Forecasting Models based on Volatility Timing Performance [J]. Chinese Journal of Management Science, 2020, 28(5): 62-70. |
| [6] | LIU Zhi-dong, ZHENG Xue-fei. A Study of Stock Price Co-jumps with Hawkes Factor Model [J]. Chinese Journal of Management Science, 2018, 26(7): 18-31. |
| [7] | ZHAO Ning, YU Fang-kun, YOU Shen, WANG Zhen-shuang. Investment Horizon, System Risk Value and the Sensitive Effect [J]. Chinese Journal of Management Science, 2018, 26(1): 72-80. |
| [8] | SONG Ya-qiong, WANG Xin-jun. Modeling and Forecasting Volatility of Chinese Stock Market Based on Dynamic Estimation Errors [J]. Chinese Journal of Management Science, 2017, 25(9): 19-27. |
| [9] | WU Xin-yu, LI Xin-dan, MA Chao-qun. Non-affine Option Pricing in the Presence of Microstructure Noises: An Empirical Study Based on the High-frequency Shanghai 50ETF Options Data [J]. Chinese Journal of Management Science, 2017, 25(12): 99-108. |
| [10] | LIU Zhi-dong, YAN Guan. Analysis of the Finer Statistical Characteristics of China Stock Market Based on Semimartingales Process [J]. Chinese Journal of Management Science, 2016, 24(5): 18-30. |
| [11] | ZHAO Jun-li, LIANG Xun. An Improvement on the Estimate of Realized Variance of Stock Yield Based on Transaction Time Sampling [J]. Chinese Journal of Management Science, 2015, 23(7): 26-34. |
| [12] | GE Jing, TIAN Xin-shi. Models and Empirical Research of Term Structure of Interest Rates in China: Based on No-Arbitrage DNS Model and DNS Model [J]. Chinese Journal of Management Science, 2015, 23(2): 29-38. |
| [13] | ZHAO Shu-ran, JIANG Ya-ping, REN Pen-min. Comparing Estimators of the High-Frequency Volatility Matrix in the Presence of Non-synchronous Trading and Market Microstructure Noise [J]. Chinese Journal of Management Science, 2015, 23(10): 19-29. |
| [14] | JIANG Cui-xia, ZHANG Shi-ying. Research on Spillover Effects in Financial Higher Moments Risk [J]. Chinese Journal of Management Science, 2009, 17(1): 17-28. |
| [15] | HE Yan-lin. An Improvement of Fama French Three-Factor Model Based on State Switch Informations [J]. Chinese Journal of Management Science, 2008, 16(1): 7-15. |
| Viewed | ||||||
|
Full text |
|
|||||
|
Abstract |
|
|||||
|
||