主管:中国科学院
主办:中国优选法统筹法与经济数学研究会
中国科学院科技战略咨询研究院
主办:中国优选法统筹法与经济数学研究会
中国科学院科技战略咨询研究院
Chinese Journal of Management Science ›› 2026, Vol. 34 ›› Issue (6): 157-170.doi: 10.16381/j.cnki.issn1003-207x.2024.0319
Previous Articles Next Articles
Fangping Yu1, Lei Zhang2, Bin Meng1( )
)
Received:2024-03-05
Revised:2024-11-25
Online:2026-06-25
Published:2026-05-22
Contact:
Bin Meng
E-mail:mengbin@dlmu.edu.cn
CLC Number:
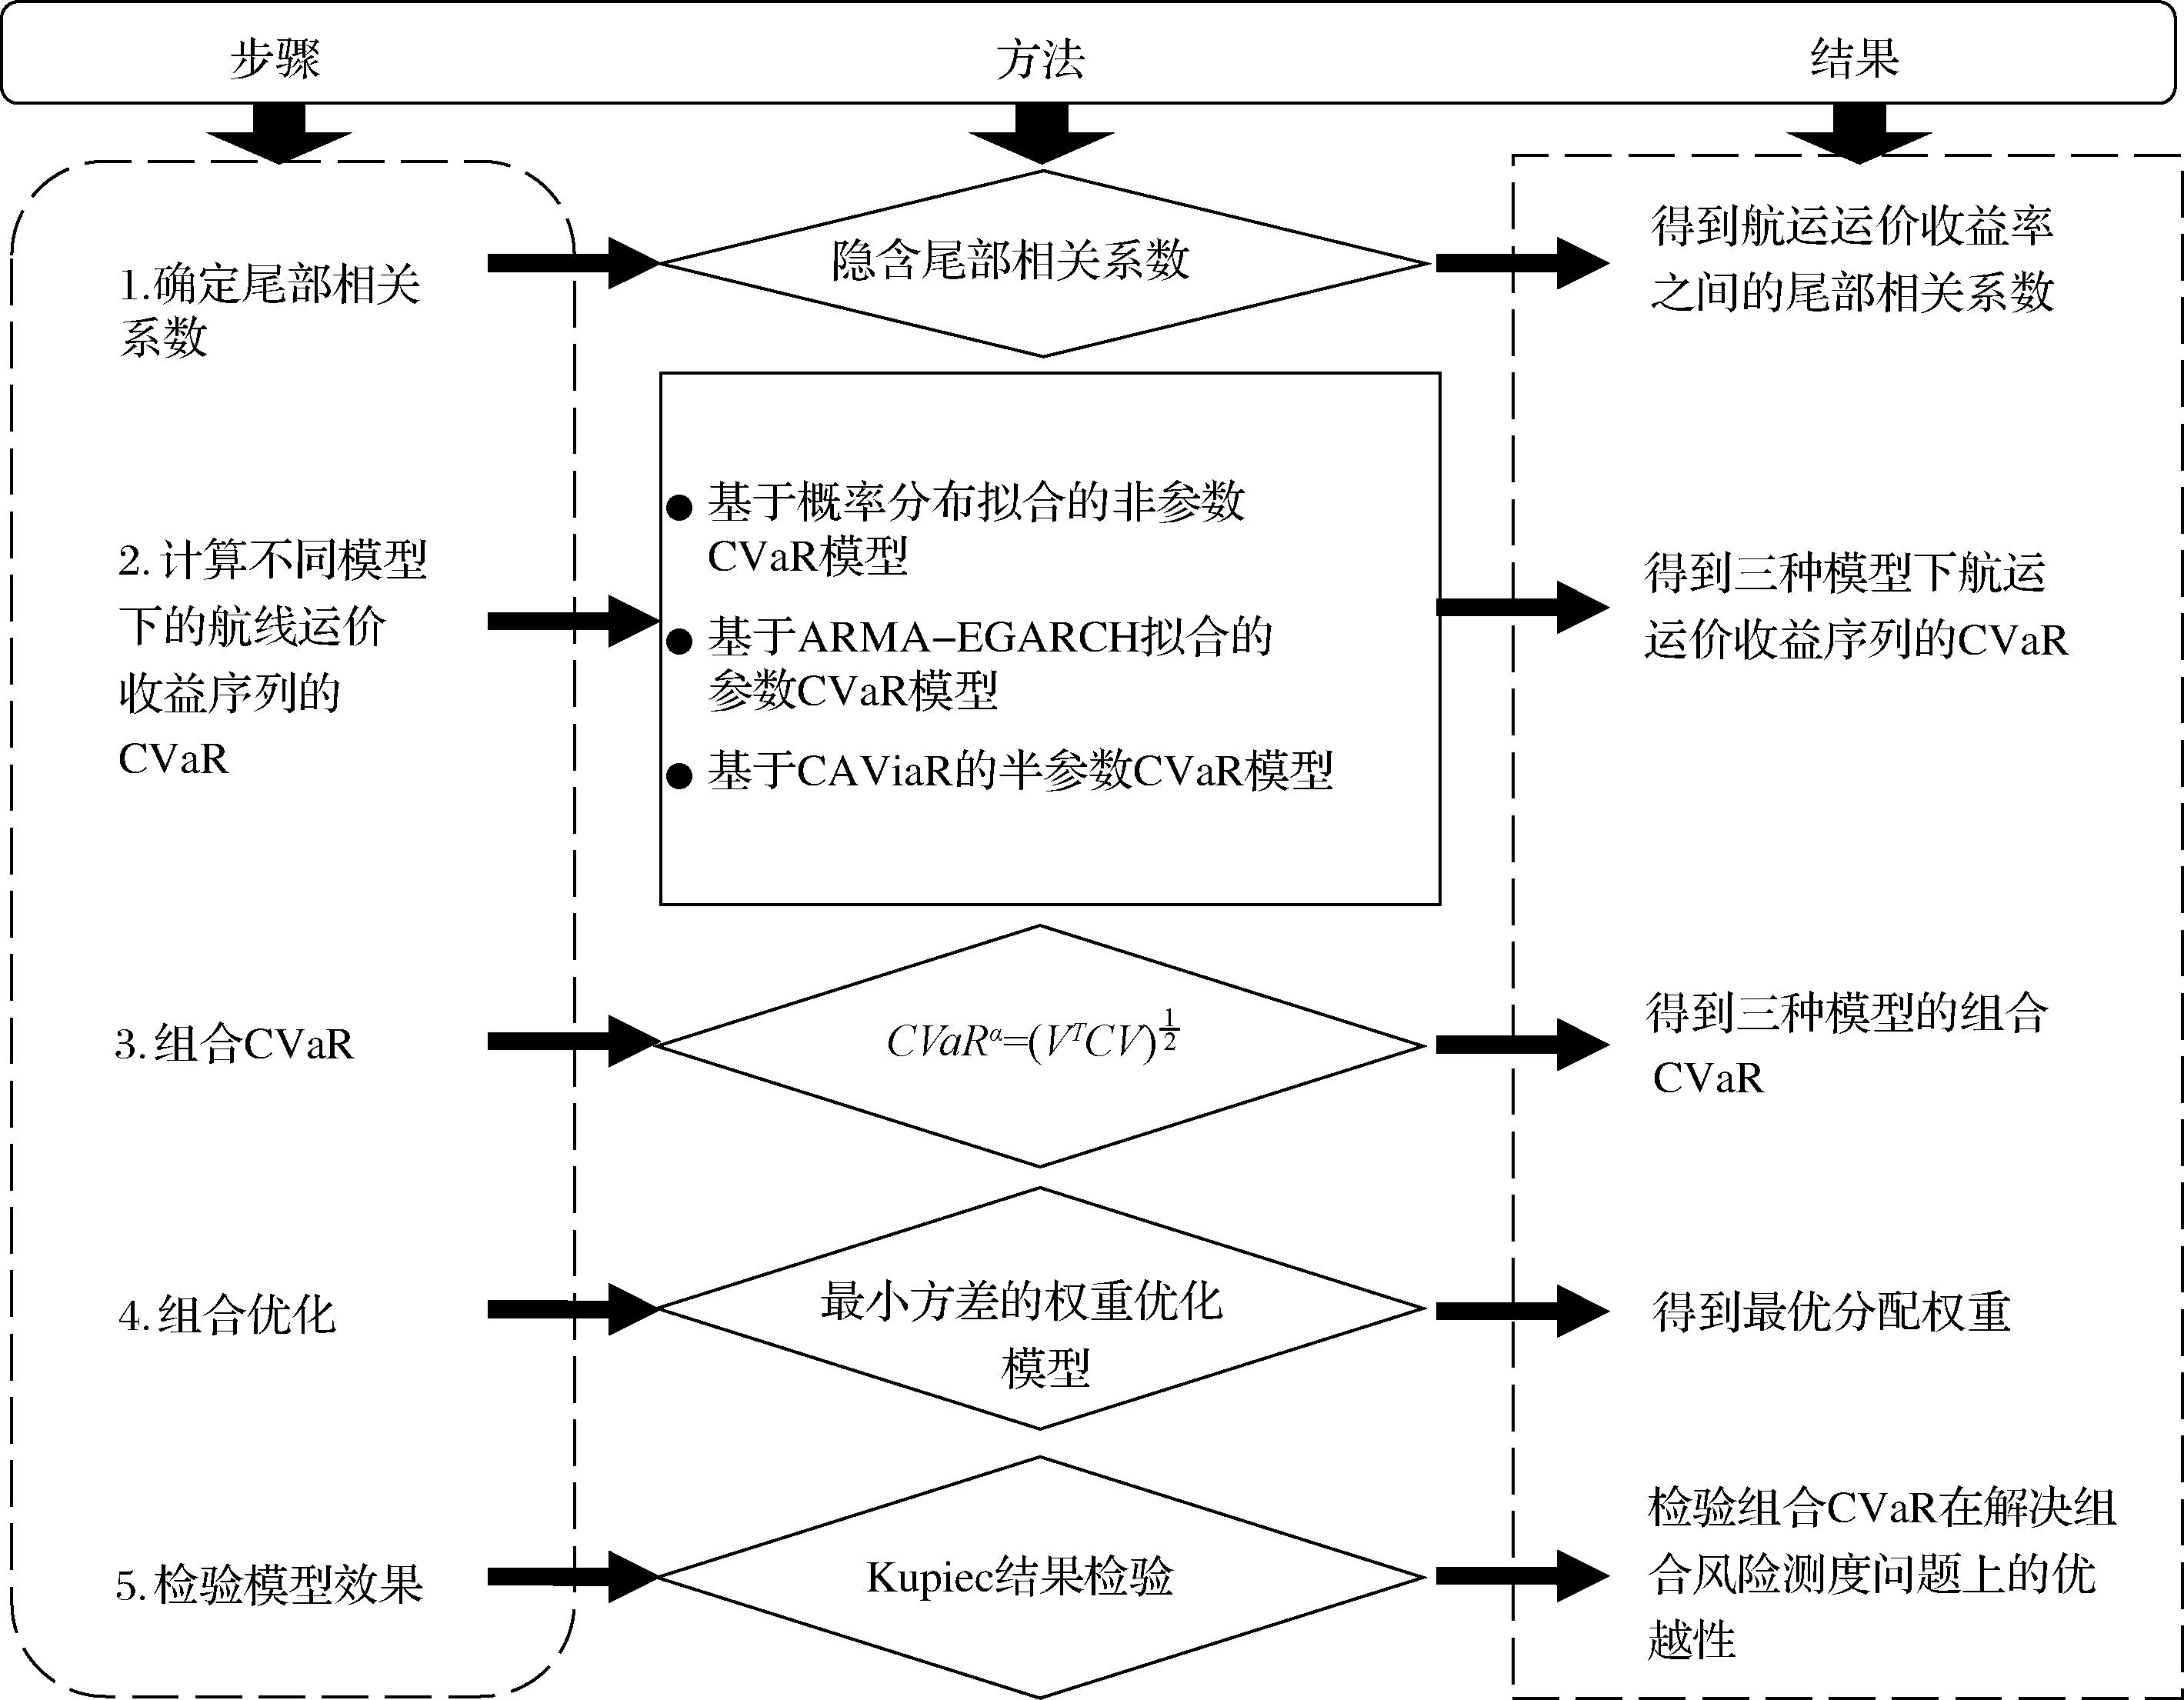
Fangping Yu,Lei Zhang,Bin Meng. Volatility-Embedded Quantitative Risk Assessment of Liner Shipping Freight Rate Portfolios[J]. Chinese Journal of Management Science, 2026, 34(6): 157-170.

"
"
| 航线 | 均值 | 最大值 | 最小值 | 标准差 | 峰度 | 偏度 | J-B |
|---|---|---|---|---|---|---|---|
| FE-NE | 0.0003 | -0.1715 | 0.4443 | 0.0290 | 71.2595 | 5.7009 | 251942.70 |
| NE-FE | -0.0003 | -0.2915 | 0.3510 | 0.0244 | 81.5502 | 2.7052 | 323108.20 |
| FE-USWC | 0.0001 | -0.1994 | 0.3513 | 0.0332 | 30.2949 | 2.9305 | 46055.59 |
| USWC-FE | 0.0003 | -0.4570 | 0.3590 | 0.0283 | 100.5485 | -2.4101 | 490165.80 |
"
| 参数 | FE-NE航线 | NE-FE航线 | FE-USWC航线 | USWC-FE航线 |
|---|---|---|---|---|
| -7.07×10⁻⁴*** | -1.44×10⁻⁴*** | -4.32×10⁻⁴ *** | -2.00×10⁻⁶*** | |
| 1.13×10⁻²*** | — | 1.83×10⁻²*** | -8.08×10⁻⁴*** | |
| — | — | -6.33×10⁻³*** | — | |
| — | — | 5.64×10⁻³*** | — | |
| -3.13×10⁻¹*** | -2.01×10⁻² *** | -1.47×10⁻¹*** | -3.53*** | |
| -3.91×10⁻²*** | -3.45×10⁻² *** | -1.23×10⁻¹*** | 2.35×10⁻²*** | |
| 9.60×10⁻¹*** | 1.0 *** | 9.84×10⁻¹*** | 7.03×10⁻¹*** | |
| 1.43×10⁻¹** | 6.13×10⁻²*** | 2.17×10⁻¹*** | 5.81×10⁻²*** | |
| shape | 2.10 | 2.10 | 2.10 | 2.10 |
"
| 参数 | FE-NE航线 | NE-FE航线 | FE-USWC航线 | USWC-FE航线 | ||||||||
|---|---|---|---|---|---|---|---|---|---|---|---|---|
| 10% | 5% | 1% | 10% | 5% | 1% | 10% | 5% | 1% | 10% | 5% | 1% | |
| 5.22×10⁻³*** | 9.15×10⁻³*** | 4.09×10⁻³*** | 8.21×10⁻³*** | 1.65×10⁻²*** | 1.33×10⁻¹*** | 1.31×10⁻²*** | 7.82×10⁻³*** | 1.11×10⁻³*** | 7.62×10⁻³*** | 2.65×10⁻²*** | 1.11×10⁻¹*** | |
| 1.90×10⁻¹*** | 3.15×10⁻¹** | 8.85×10⁻¹*** | -8.91×10⁻²*** | -1.84×10⁻¹*** | -9.98×10⁻¹*** | -1.49×10⁻¹*** | 4.4010-1*** | 8.80×10⁻¹*** | -7.70×10⁻²*** | -2.98×10⁻¹*** | -9.88×10⁻¹*** | |
| 4.88×10⁻²*** | 3.16×10⁻²*** | -7.1210-3*** | 1.81×10⁻²*** | 1.42×10⁻¹*** | -1.29*** | 1.88×10⁻²*** | 1,01*** | 1.89×10⁻¹*** | -1.24×10⁻²*** | -1.18×10⁻¹*** | -1.03*** | |
| 9.93×10⁻¹*** | 9.17×10⁻¹*** | 3.97×10⁻¹** | 9.58×10⁻¹*** | 9.16×10⁻¹*** | 1.73*** | 1.21*** | 9.96×10⁻¹*** | 6.60×10⁻¹** | 9.59×10⁻¹*** | 8.87×10⁻¹*** | 1.36*** | |
| RQ | 2.43 | 1.66 | 0.551 | 2.61 | 1.69 | 0.704 | 2.96 | 1.99 | 0.714 | 2.09 | 1.5 | 0.509 |
CVaR (%) | -1.29 | -1.69 | -6.64 | -1.03 | -1.62 | -7.90 | -1.05 | -2.40 | -5.44 | -1.86 | -4.46 | -5.52 |
"
| 航线 | AEG | CAV | |||||||
|---|---|---|---|---|---|---|---|---|---|
| 10% | 5% | 1% | 10% | 5% | 1% | 10% | 5% | 1% | |
| FE-NE(%) | -5.00 | -6.19 | -7.78 | -4.23 | -5.15 | -6.99 | -3.29 | -3.69 | -8.64 |
| NE-FE(%) | -3.39 | -3.83 | -4.83 | -5.73 | -7.27 | -10.86 | -3.98 | -4.57 | -10.85 |
| FE-USWC(%) | -8.62 | -9.71 | -12.19 | -5.86 | -7.14 | -12.07 | -3.28 | -6.78 | -9.82 |
| USWC-FE(%) | -5.29 | -5.97 | -7.52 | -7.17 | -9.07 | -13.47 | -7.73 | -10.33 | -10.16 |
"
| 航线间关系 | CVaR10%定阶 | CVaR5%定阶 | CVaR1%定阶 |
|---|---|---|---|
| FE-NE和 NE-FE | ARIMA(1,1,0) | ARIMA(1,2,0) | ARIMA(1,2,0) |
| FE-NE和FE-USWC | ARIMA(1,1,0) | ARIMA(2,1,0) | ARIMA(2,1,0) |
| FE-NE和 USWC-FE | ARIMA(1,1,0) | ARIMA(1,1,0) | ARIMA(1,1,0) |
| NE-FE和FE-USWC | ARIMA(0,1,0) | ARIMA(1,0,0) | ARIMA(0,1,0) |
| NE-FE和 USWC-FE | ARIMA(1,1,0) | ARIMA(1,1,0) | ARIMA(1,1,0) |
| FE-USWC 和 USWC-FE | ARIMA(1,1,0) | ARIMA(1,1,0) | ARIMA(1,1,0) |

"

"

"
"
| 参数 | AEG | CAV | |||||||
|---|---|---|---|---|---|---|---|---|---|
| 10% | 5% | 1% | 10% | 5% | 1% | 10% | 5% | 1% | |
| 预测值(%) | -12.99 | -14.23 | -15.79 | -12.19 | -13.90 | -17.16 | -10.35 | -25.03 | -36.05 |
| HS值(%) | -10.16 | -14.12 | -18.63 | -10.16 | -14.12 | -18.63 | -6.71 | -9.65 | -13.71 |
"

"
"

"

"
| 模型 | 置信水平90% | 置信水平95% | 置信水平99% |
|---|---|---|---|
| AEG | -0.0505 | 0.1623 | 0.2624 |
| 0.0894 | -0.0119 | -0.0570 | |
| CAV | 0.9612 | 0.8495 | 0.7946 |
"
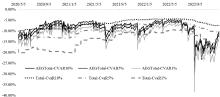
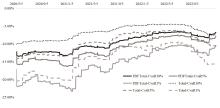
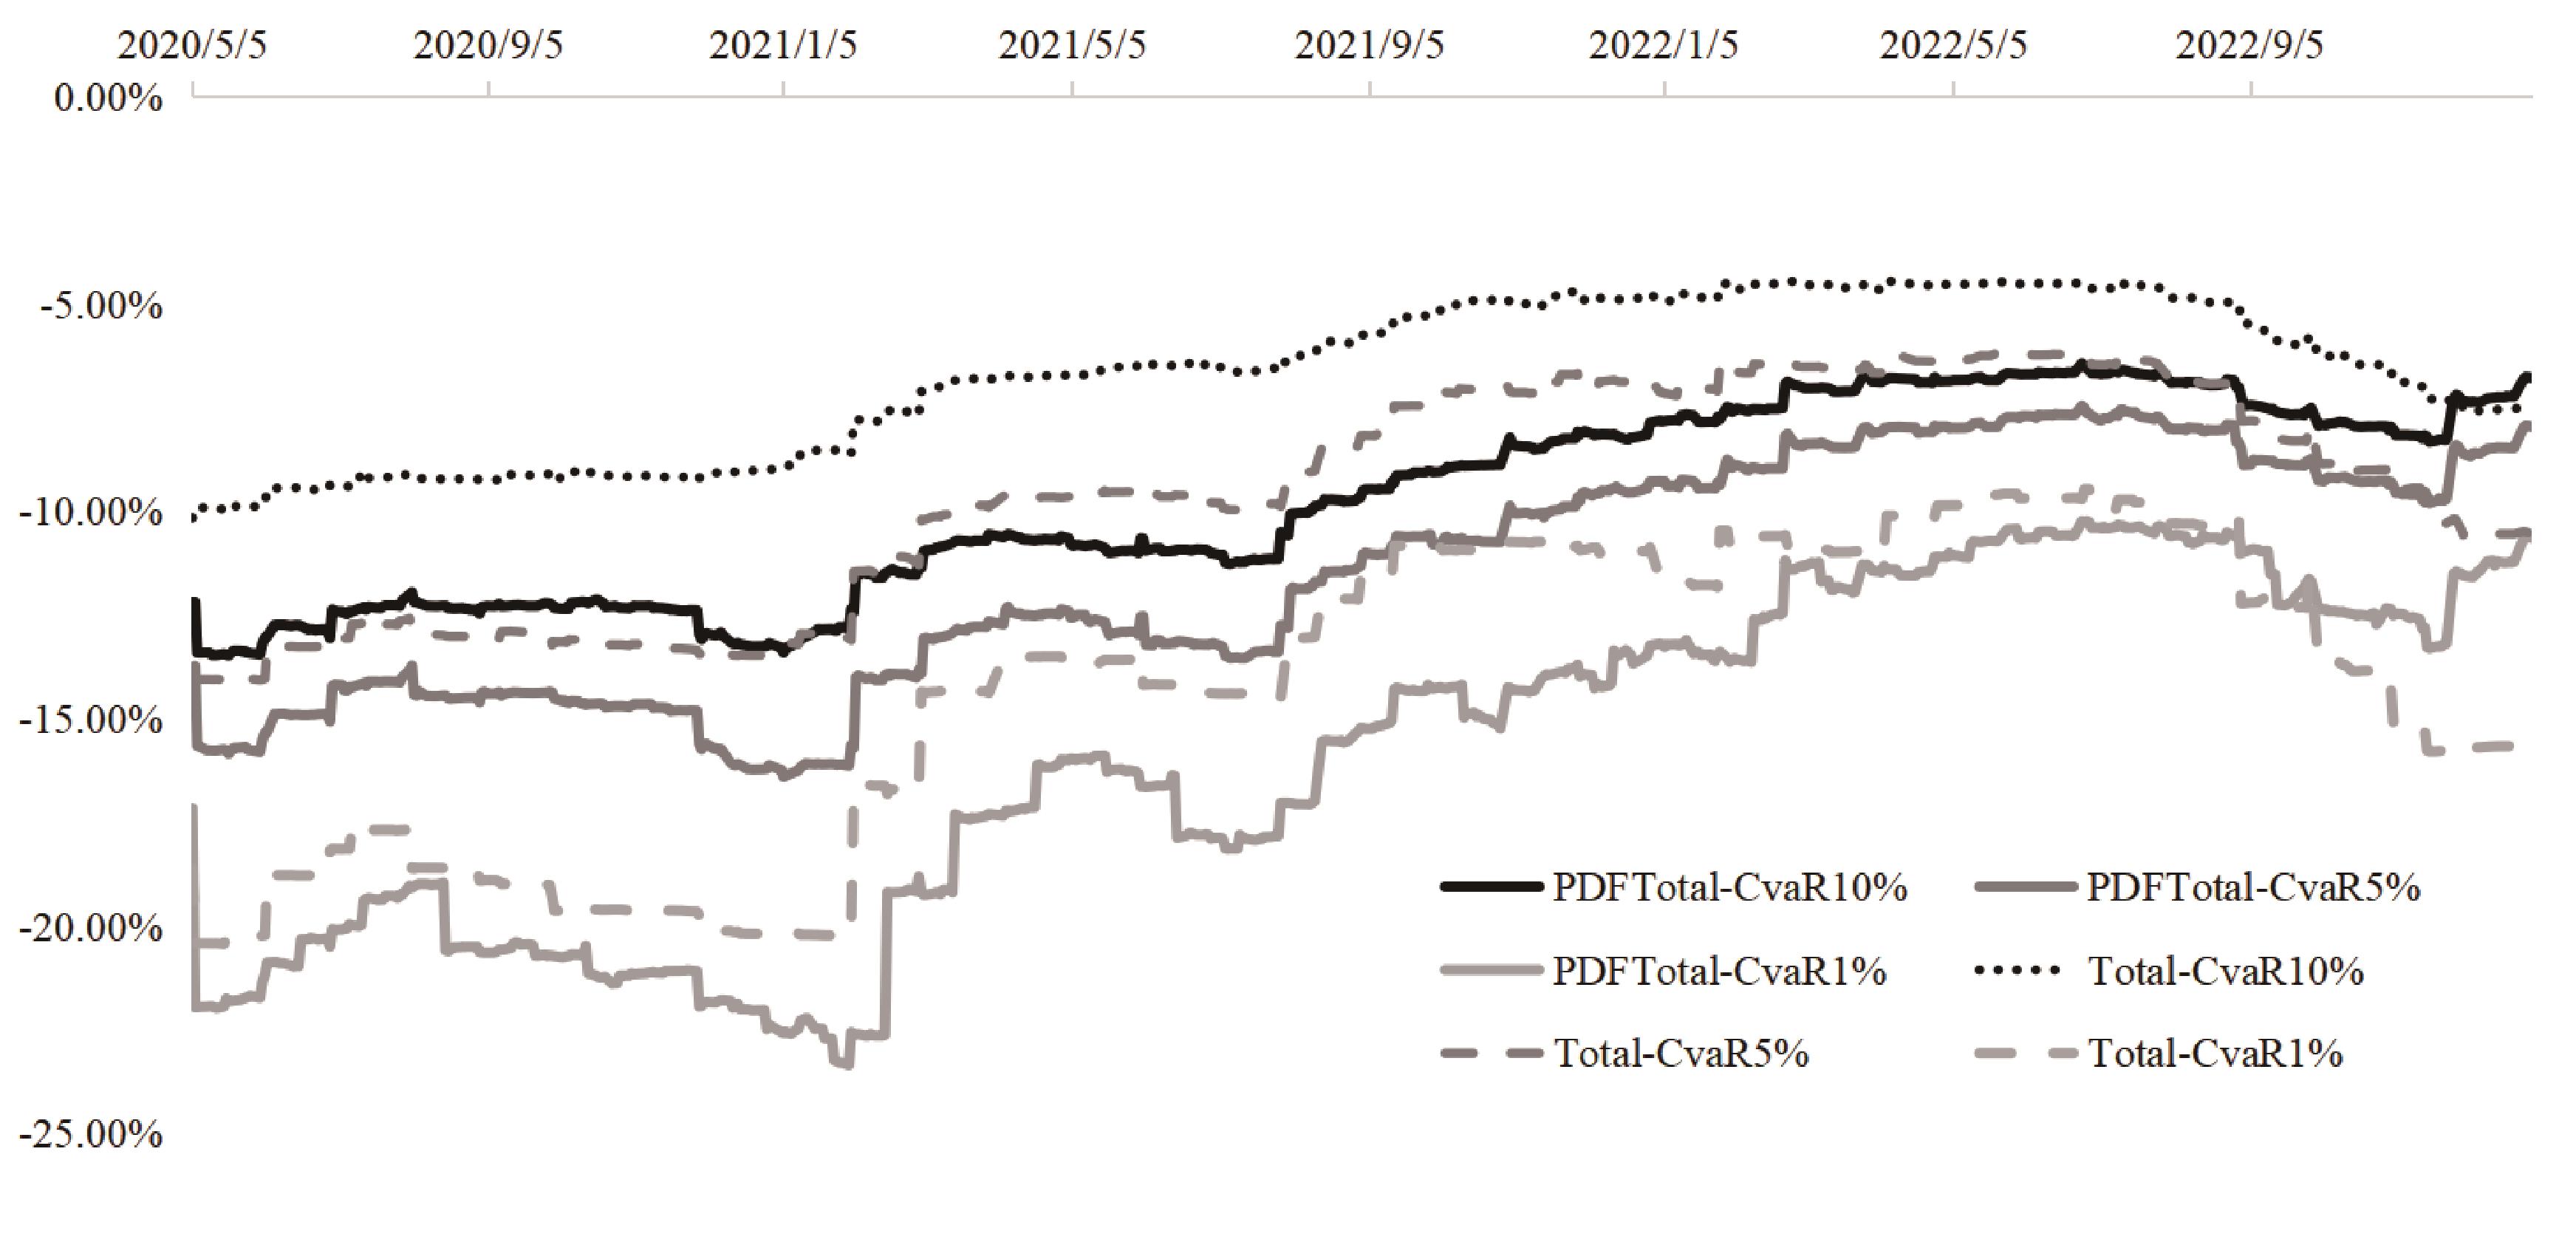
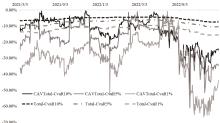
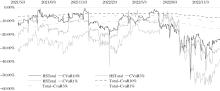
| 时间 | AEGTotal-CVaR | PDFTotal-CVaR | CAVTotal-CVaR | Total-CVaR | HS-CVaR | |||||||||||
|---|---|---|---|---|---|---|---|---|---|---|---|---|---|---|---|---|
| 10% | 5% | 1% | 10% | 5% | 1% | 10% | 5% | 1% | 10% | 5% | 1% | 10% | 5% | 1% | ||
| 平稳期 | 2021-05-05 | -6.90 | -8.21 | -9.60 | -10.83 | -12.56 | -15.97 | -11.65 | -20.79 | -39.08 | -11.81 | -18.84 | -32.66 | -6.71 | -9.63 | -13.70 |
| 2021-05-12 | -6.16 | -7.32 | -8.50 | -10.82 | -12.67 | -15.99 | -11.48 | -18.93 | -34.24 | -11.69 | -17.12 | -28.53 | -6.66 | -9.67 | -13.72 | |
| 2021-05-25 | -7.08 | -8.40 | -9.74 | -10.95 | -12.90 | -16.21 | -9.38 | -17.39 | -34.13 | -9.64 | -15.98 | -28.75 | -6.52 | -9.53 | -13.58 | |
| 2021-05-31 | -6.40 | -7.59 | -8.78 | -10.95 | -12.90 | -16.28 | -9.31 | -16.78 | -34.76 | -9.61 | -15.33 | -29.00 | -6.52 | -9.54 | -13.57 | |
| 2021-06-04 | -7.45 | -8.89 | -10.43 | -10.94 | -13.21 | -16.65 | -8.55 | -6.91 | -26.61 | -8.82 | -7.15 | -22.93 | -6.47 | -9.60 | -14.18 | |
剧烈 波动 期 | 2022-11-18 | -18.74 | -20.60 | -24.57 | -8.32 | -9.80 | -13.30 | -40.04 | -51.74 | -62.30 | -38.28 | -47.18 | -55.19 | -7.29 | -10.22 | -15.79 |
| 2022-11-23 | -17.51 | -19.32 | -23.07 | -8.26 | -9.73 | -13.25 | -28.51 | -37.95 | -61.45 | -27.26 | -35.26 | -54.13 | -7.30 | -10.23 | -15.78 | |
| 2022-11-28 | -15.99 | -17.66 | -21.03 | -7.30 | -8.50 | -11.51 | -26.69 | -36.62 | -57.02 | -25.50 | -33.87 | -50.17 | -7.26 | -10.18 | -15.60 | |
| 2022-12-02 | -18.14 | -20.18 | -24.06 | -7.33 | -8.61 | -11.55 | -32.63 | -44.49 | -54.74 | -31.10 | -40.97 | -49.16 | -7.51 | -10.57 | -15.70 | |
| 2022-12-08 | -17.36 | -19.10 | -22.71 | -7.36 | -8.60 | -11.45 | -25.30 | -33.55 | -58.36 | -24.10 | -31.50 | -51.68 | -7.57 | -10.57 | -15.69 | |
"
| 模型 | 置信水平90% | 置信水平95% | 置信水平99% | |||
|---|---|---|---|---|---|---|
| 失败个数N | 失败率(R=N/T) | 失败个数N | 失败率(R=N/T) | 失败个数N | 失败率(R=N/T) | |
| AEG | 192 | 192/672=0.286 | 336 | 336/672=0.5 | 510 | 510/672=0.759 |
| 23 | 23/672=0.0342 | 32 | 32/672=0.0476 | 84 | 84/672=0.125 | |
| CAV | 68 | 68/422=0.1611 | 34 | 34/422=0.008 | 24 | 24/422=0.056 |
| 组合优化模型 | 43 | 43/422=0.1019 | 22 | 22/422=0.00521 | 8 | 8/422=0.019 |
| [1] | Nomikos N K, Kyriakou I, Papapostolou N C, et al. Freight options: Price modelling and empirical analysis[J]. Transportation Research Part E: Logistics and Transportation Review, 2013, 51: 82-94. |
| [2] | Yu F, Xiang Z, Wang X, et al. An innovative tool for cost control under fragmented scenarios: The container freight index microinsurance[J]. Transportation Research Part E: Logistics and Transportation Review, 2023, 169: 102975. |
| [3] | 孟斌, 林晓倩, 匡海波, 等. 经济政策不确定性对航运市场与金融市场的长记忆联动影响[J]. 系统工程理论与实践, 2023, 43(7): 1927-1945. |
| Meng B, Lin X Q, Kuang H B, et al. Research on the long memory linkage effect of economic policy uncertainty on shipping market and financial market[J]. Systems Engineering-Theory & Practice, 2023, 43(7): 1927-1945. | |
| [4] | Argyropoulos C, Panopoulou E. Measuring the market risk of freight rates: A forecast combination approach[J]. Journal of Forecasting, 2018, 37(2): 201-224. |
| [5] | Scarsi R. The bulk shipping business: Market cycles and shipowners’ biases[J]. Maritime Policy & Management, 2007, 34(6): 577-590. |
| [6] | 余方平, 匡海波. 基于VMD-GRGC-FFT的BDI指数周期特性研究[J]. 管理评论,2017,29(4): 213-225. |
| Yu F P, Kuang H B. The detection of BDI index hidden periodicities: A VMD-GRGC-FFT ensemble methods[J]. Management Review, 2017, 29(4): 213-225. | |
| [7] | Tezuka K, Ishii M, Ishizaka M. An equilibrium price model of spot and forward shipping freight markets[J]. Transportation Research Part E: Logistics and Transportation Review, 2012, 48(4): 730-742. |
| [8] | 孟斌, 陈水养, 匡海波. 基于时频依赖的大宗商品市场和干散货运输市场动态信息溢出[J]. 中国管理科学, 2025, 33(12): 13-25. |
| Meng B, Chen S Y, Kuang H B. The dynamic information spillover co-movement between commodity market and dry bulk shipping market: A time-frequency dependent analysis[J]. Chinese Journal of Management Science, 2025, 33(12): 13-25. | |
| [9] | Goulielmos A M, Psifia M. Shipping finance: Time to follow a new track?[J]. Maritime Policy & Management, 2006, 33(3): 301-320. |
| [10] | Gong Y, Li K X, Chen S L, et al. Contagion risk between the shipping freight and stock markets: Evidence from the recent US-China trade war[J]. Transportation Research Part E: Logistics and Transportation Review, 2020, 136: 101900. |
| [11] | Pouliasis P K, Papapostolou N C, Kyriakou I, et al. Shipping equity risk behavior and portfolio management[J]. Transportation Research Part A: Policy and Practice, 2018, 116: 178-200. |
| [12] | Wen D, Wang Y, Ma C, et al. Information transmission between gold and financial assets: Mean, volatility, or risk spillovers?[J]. Resources Policy, 2020, 69: 101871. |
| [13] | 余方平, 匡海波. BDI指数非线性均值回复特性研究[J]. 管理科学学报, 2018, 21(9): 118-126. |
| Yu F P, Kuang H B. BDI index nonlinear mean reversion characteristic[J]. Journal of Management Sciences in China, 2018, 21(9): 118-126. | |
| [14] | 余方平, 张凯利, 匡海波, 等. 面向中小微出口企业成本控制的集装箱运价指数保险研究[J]. 中国管理科学, 2023, 31(6): 131-141. |
| Yu F P, Zhang K L, Kuang H B, et al. Research on the container freight index insurance for medium, small and micro export enterprises cost control[J]. Chinese Journal of Management Science, 2023, 31(6): 131-141. | |
| [15] | Liu J. A new tail-based correlation measure and its application in global equity markets[J]. Journal of Financial Econometrics, 2023, 21(3): 959-987. |
| [16] | Bai X, Lam J S L. Freight rate co-movement and risk spillovers in the product tanker shipping market: A copula analysis[J]. Transportation Research Part E: Logistics and Transportation Review, 2021, 149: 102315. |
| [17] | 孟斌, 陈水养, 杨默, 等. 考虑微观航线的原油油轮运输市场中的运费联动和风险溢出[J]. 管理评论, 2024, 36(12): 97-110. |
| Meng B, Chen S Y, Yang M, et al. Freight rate co-movement and risk spillovers in the dirty tanker shipping market based on micro shipping routes[J]. Management Review, 2024, 36(12): 97-110. | |
| [18] | Bai X, Lam J S L. Portfolio value-at-risk estimation for spot chartering decisions under changing trade patterns: A copula approach[J]. Risk Analysis, 2023, 43(6): 1278-1292. |
| [19] | Angelidis T, Skiadopoulos G. Measuring the market risk of freight rates: A value-at-risk approach[J]. International Journal of Theoretical and Applied Finance, 2008, 11(5): 447-469. |
| [20] | Chang C C, Chih Chou H, Chun C W. Value-at-risk analysis of the asymmetric long-memory volatility process of dry bulk freight rates[J]. Maritime Economics & Logistics, 2014, 16(3): 298-320. |
| [21] | Benth F E, Koekebakker S, Taib C M I C. Stochastic dynamical modelling of spot freight rates[J]. IMA Journal of Management Mathematics, 2015, 26(3): 273-297. |
| [22] | Población J, Serna G. Measuring bulk shipping prices risk[J]. Maritime Economics & Logistics, 2021, 23(2): 291-309. |
| [23] | Basdekis C, Christopoulos A, Gkolfinopoulos A, et al. VaR as a risk management framework for the spot and futures tanker markets[J]. Operational Research, 2022, 22(4): 4287-4352. |
| [24] | Zheng W, Li B, Song D P. Effects of risk-aversion on competing shipping lines’ pricing strategies with uncertain demands[J]. Transportation Research Part B: Methodological, 2017, 104: 337-356. |
| [25] | 薛凯丽, 匡海波, 尹航, 等. 基于混合Clayton Copula模型的原油价格与油轮市场的风险传染效应研究[J]. 管理评论, 2023, 35(9): 262-273. |
| Xue K L, Kuang H B, Yin H, et al. Study on the risk contagion effect of crude oil prices and tanker market based on mixed clayton copula model[J]. Management Review, 2023, 35(9): 262-273. | |
| [26] | Yang J, Zhang X, Ge Y E. Measuring risk spillover effects on dry bulk shipping market: A value-at-risk approach[J]. Maritime Policy & Management, 2022, 49(4): 558-576. |
| [27] | Abouarghoub W. Implementing the new science of risk management to tanker freight markets[D]. Bristol: University of the West of England, Bristol, 2013. |
| [28] | Abouarghoub W, Mariscal I. Measuring level of risk exposure in tanker shipping freight markets[J]. International Journal of Business and Social Research, 2011, 1(1): 20-44. |
| [29] | Ünal G, Köseoğlu S D. Revealing the freight market risk in Istfix shipping area[J]. International Journal of Shipping and Transport Logistics, 2014, 6(6): 593-610. |
| [30] | Siddiqui A W, Verma M. A conditional value-at-risk based methodology to intermediate-term planning of crude oil tanker fleet[J]. Computers & Industrial Engineering, 2017, 113: 405-418. |
| [31] | Theodossiou P, Tsouknidis D, Savva C. Freight rates in downside and upside markets: Pricing of own and spillover risks from other shipping segments[J]. Journal of the Royal Statistical Society Series A: Statistics in Society, 2020, 183(3): 1097-1119. |
| [32] | 孟斌, 李寅洁, 包玉. 基于LT-TVP-VAR模型的中美贸易战对航运市场的时变影响研究[J]. 科研管理, 2023, 44(9): 182-192. |
| Meng B, Li Y J, Bao Y. An empirical study of the time-varying impact of the China-US trade war on the shipping market based on the LT-TVP-VAR Model[J]. Science Research Management, 2023, 44(9): 182-192. | |
| [33] | Jing L, Marlow P B, Hui W. An analysis of freight rate volatility in dry bulk shipping markets[J]. Maritime Policy & Management, 2008, 35(3): 237-251. |
| [34] | Engle R F, Manganelli S. CAViaR: Conditional autoregressive value at risk by regression quantiles[J]. Journal of Business & Economic Statistics, 2004, 22(4): 367-381. |
| [35] | 孟斌, 廉荣文隽, 隋聪, 等. 重大事件是否影响了航运市场溢出传递的稳定性[J]. 中国管理科学, 2023, 31(11): 46-57. |
| Meng B, Lian R W J, Sui C, et al. Do major events affect the stability of shipping market spillover and transmission?[J]. Chinese Journal of Management Science, 2023, 31(11): 46-57. | |
| [36] | Artzner P, Delbaen F, Eber J M, et al. Coherent measures of risk[J]. Mathematical Finance, 1999, 9(3): 203-228. |
| [37] | Kupiec P H. Techniques for verifying the accuracy of risk measurement models[J]. The Journal of Derivatives, 1995, 3(2): 73-84. |
| [38] | Norton M, Khokhlov V, Uryasev S. Calculating CVaR and bPOE for common probability distributions with application to portfolio optimization and density estimation[J]. Annals of Operations Research, 2021, 299(1): 1281-1315. |
| [1] | LI De-chang, YANG Hua-long, SONG Wei, ZHENG Jian-feng. Freight Revenue Robust Optimization for Container Liner Shipping Considering Vessel Sailing Speed Deviation [J]. Chinese Journal of Management Science, 2023, 31(4): 151-160. |
| Viewed | ||||||
|
Full text |
|
|||||
|
Abstract |
|
|||||
|
||