主管:中国科学院
主办:中国优选法统筹法与经济数学研究会
中国科学院科技战略咨询研究院
主办:中国优选法统筹法与经济数学研究会
中国科学院科技战略咨询研究院
Chinese Journal of Management Science ›› 2026, Vol. 34 ›› Issue (3): 122-133.doi: 10.16381/j.cnki.issn1003-207x.2023.0115
Previous Articles Next Articles
Shuran Zhao1, Jinchen Li1( ), Jie Zhang1, Peimin Ren2
Received:2023-01-19
Revised:2024-02-04
Online:2026-03-25
Published:2026-03-06
Contact:
Jinchen Li
E-mail:jinchen_li@163.com
CLC Number:
Shuran Zhao,Jinchen Li,Jie Zhang, et al. Construction and Application of High-frequency Network Volatility Matrix Model[J]. Chinese Journal of Management Science, 2026, 34(3): 122-133.
"
| — | |||||||
|---|---|---|---|---|---|---|---|
| 平均值 | 0.4190 | 0.4830 | -0.1522 | 0.4315 | 0.5567 | -0.2534 | 0.2046 |
| 最大值 | 0.9904 | 0.9904 | -1.47×10⁻⁶ | 0.9970 | 0.9970 | -3.60×10⁻⁶ | 1.2779 |
| 最小值 | -0.8141 | 1.30×10⁻⁶ | -0.8141 | -0.9179 | 2.23×10⁻⁵ | -0.9179 | 2.24×10⁻⁷ |
| 标准差 | 0.3009 | 0.2414 | 0.1260 | 0.3845 | 0.2586 | 0.1898 | 0.1686 |

"

"
| 统计项 | 总体峰度 | 方差峰度 | 协方差峰度 | 总体偏度 | 方差偏度 | 协方差偏度 |
|---|---|---|---|---|---|---|
| 均值 | 169.28 | 112.44 | 175.26 | 10.55 | 8.37 | 10.79 |
| 标准差 | 76.77 | 68.79 | 75.26 | 2.49 | 2.51 | 2.38 |
"
| 统计项 | 阶数 | 1 | 2 | 3 | 4 | 5 | 10 | 20 |
|---|---|---|---|---|---|---|---|---|
| 自相关 | 方差 | 0.549 | 0.435 | 0.437 | 0.436 | 0.409 | 0.251 | 0.150 |
| 协方差 | 0.519 | 0.393 | 0.412 | 0.415 | 0.360 | 0.194 | 0.206 | |
| 偏自相关 | 方差 | 0.549 | 0.183 | 0.207 | 0.158 | 0.097 | -0.043 | 0.010 |
| 协方差 | 0.519 | 0.158 | 0.224 | 0.159 | 0.058 | -0.047 | 0.037 |
"
| 典型相关系数 | 日度正向 | 日度负向 | 周度正向 | 周度负向 |
|---|---|---|---|---|
| 0.5591*** | 0.3462*** | 0.2051*** | 0.2993*** | 0.2188*** |
"
| 股票名称 | ||||||
|---|---|---|---|---|---|---|
| 中国建设银行 | 0.0201*** | -0.2135 | 0.2578 | 0.0296*** | 0.0842*** | 0.6999*** |
| 中国银行 | 0.0008*** | -0.1634*** | 0.5529 | 0.0501 | 0.1236 | 0.6110 |
| 中国农业银行 | 0.0063*** | -0.1426 | 0.3954*** | 0.0187*** | 0.0748*** | 0.6769 |
| 中国交通银行 | 0.0162 | -0.1327*** | 0.4274*** | 0.0205*** | 0.1289 | 0.6543*** |
| 中国工商银行 | 0.0125 | -0.1482*** | 0.3186 | 0.0329 | 0.0359*** | 0.5171 |
| 中国民生银行 | 0.0176*** | -0.1488*** | 0.6813*** | 0.0052 | 0.1530 | 0.6721*** |
| 太平洋保险 | 0.0431 | -0.1526*** | -0.0161 | 0.0126*** | 0.0150*** | 0.6548*** |
| 中国人寿保险 | 0.0228*** | -0.1661 | 0.2607*** | 0.0118*** | 0.0260*** | 0.7193*** |
| 海通证券 | 0.1224 | -0.2034 | -0.7442 | 0.0155*** | 0.0057*** | 0.6268*** |
| 金地集团 | 0.1376*** | -0.1605 | -0.6797*** | 0.0358 | -0.1050*** | 0.3868 |
| 上海国际机场 | 0.0761*** | -0.1146*** | -0.2069*** | -0.0136 | 0.0134 | 0.8026*** |
| 大秦铁路 | 0.0079 | -0.1410*** | 0.6492*** | -0.0023*** | 0.0678 | 0.7010*** |
| 中国石化 | 0.0029*** | -0.1419*** | 0.4154*** | 0.0119 | 0.0597 | 0.5285** |
| 中国石油 | 0.0126 | -0.1416 | 0.1538 | 0.0280*** | -0.0591*** | 0.5167*** |
| 海油工程 | 0.0304 | -0.1791*** | 0.2401*** | -0.0066*** | 0.0042 | 0.7503*** |
| 中国建筑 | 0.0393 | -0.1515 | 0.3485 | -0.0090*** | -0.1449*** | 0.6572*** |
| 中国交建 | 0.0671 | -0.3463*** | 0.1821 | -0.0028 | -0.0147 | 0.7236 |
| 北方稀土 | 0.0479 | -0.3364*** | 0.1779 | -0.0193*** | 0.1286 | 0.7992 *** |
| 三一重工 | 0.0240 | -0.1251*** | 0.3653*** | -0.0041*** | 0.1644*** | 0.7139*** |
| 贵州茅台酒 | 0.0398 | -0.0944 | 0.1232*** | 0.0186 | 0.0473 | 0.4435 |
| F范数 | 0.2344 | 0.8113 | 1.8477 | 0.0953 | 0.4020 | 2.9159 |
"
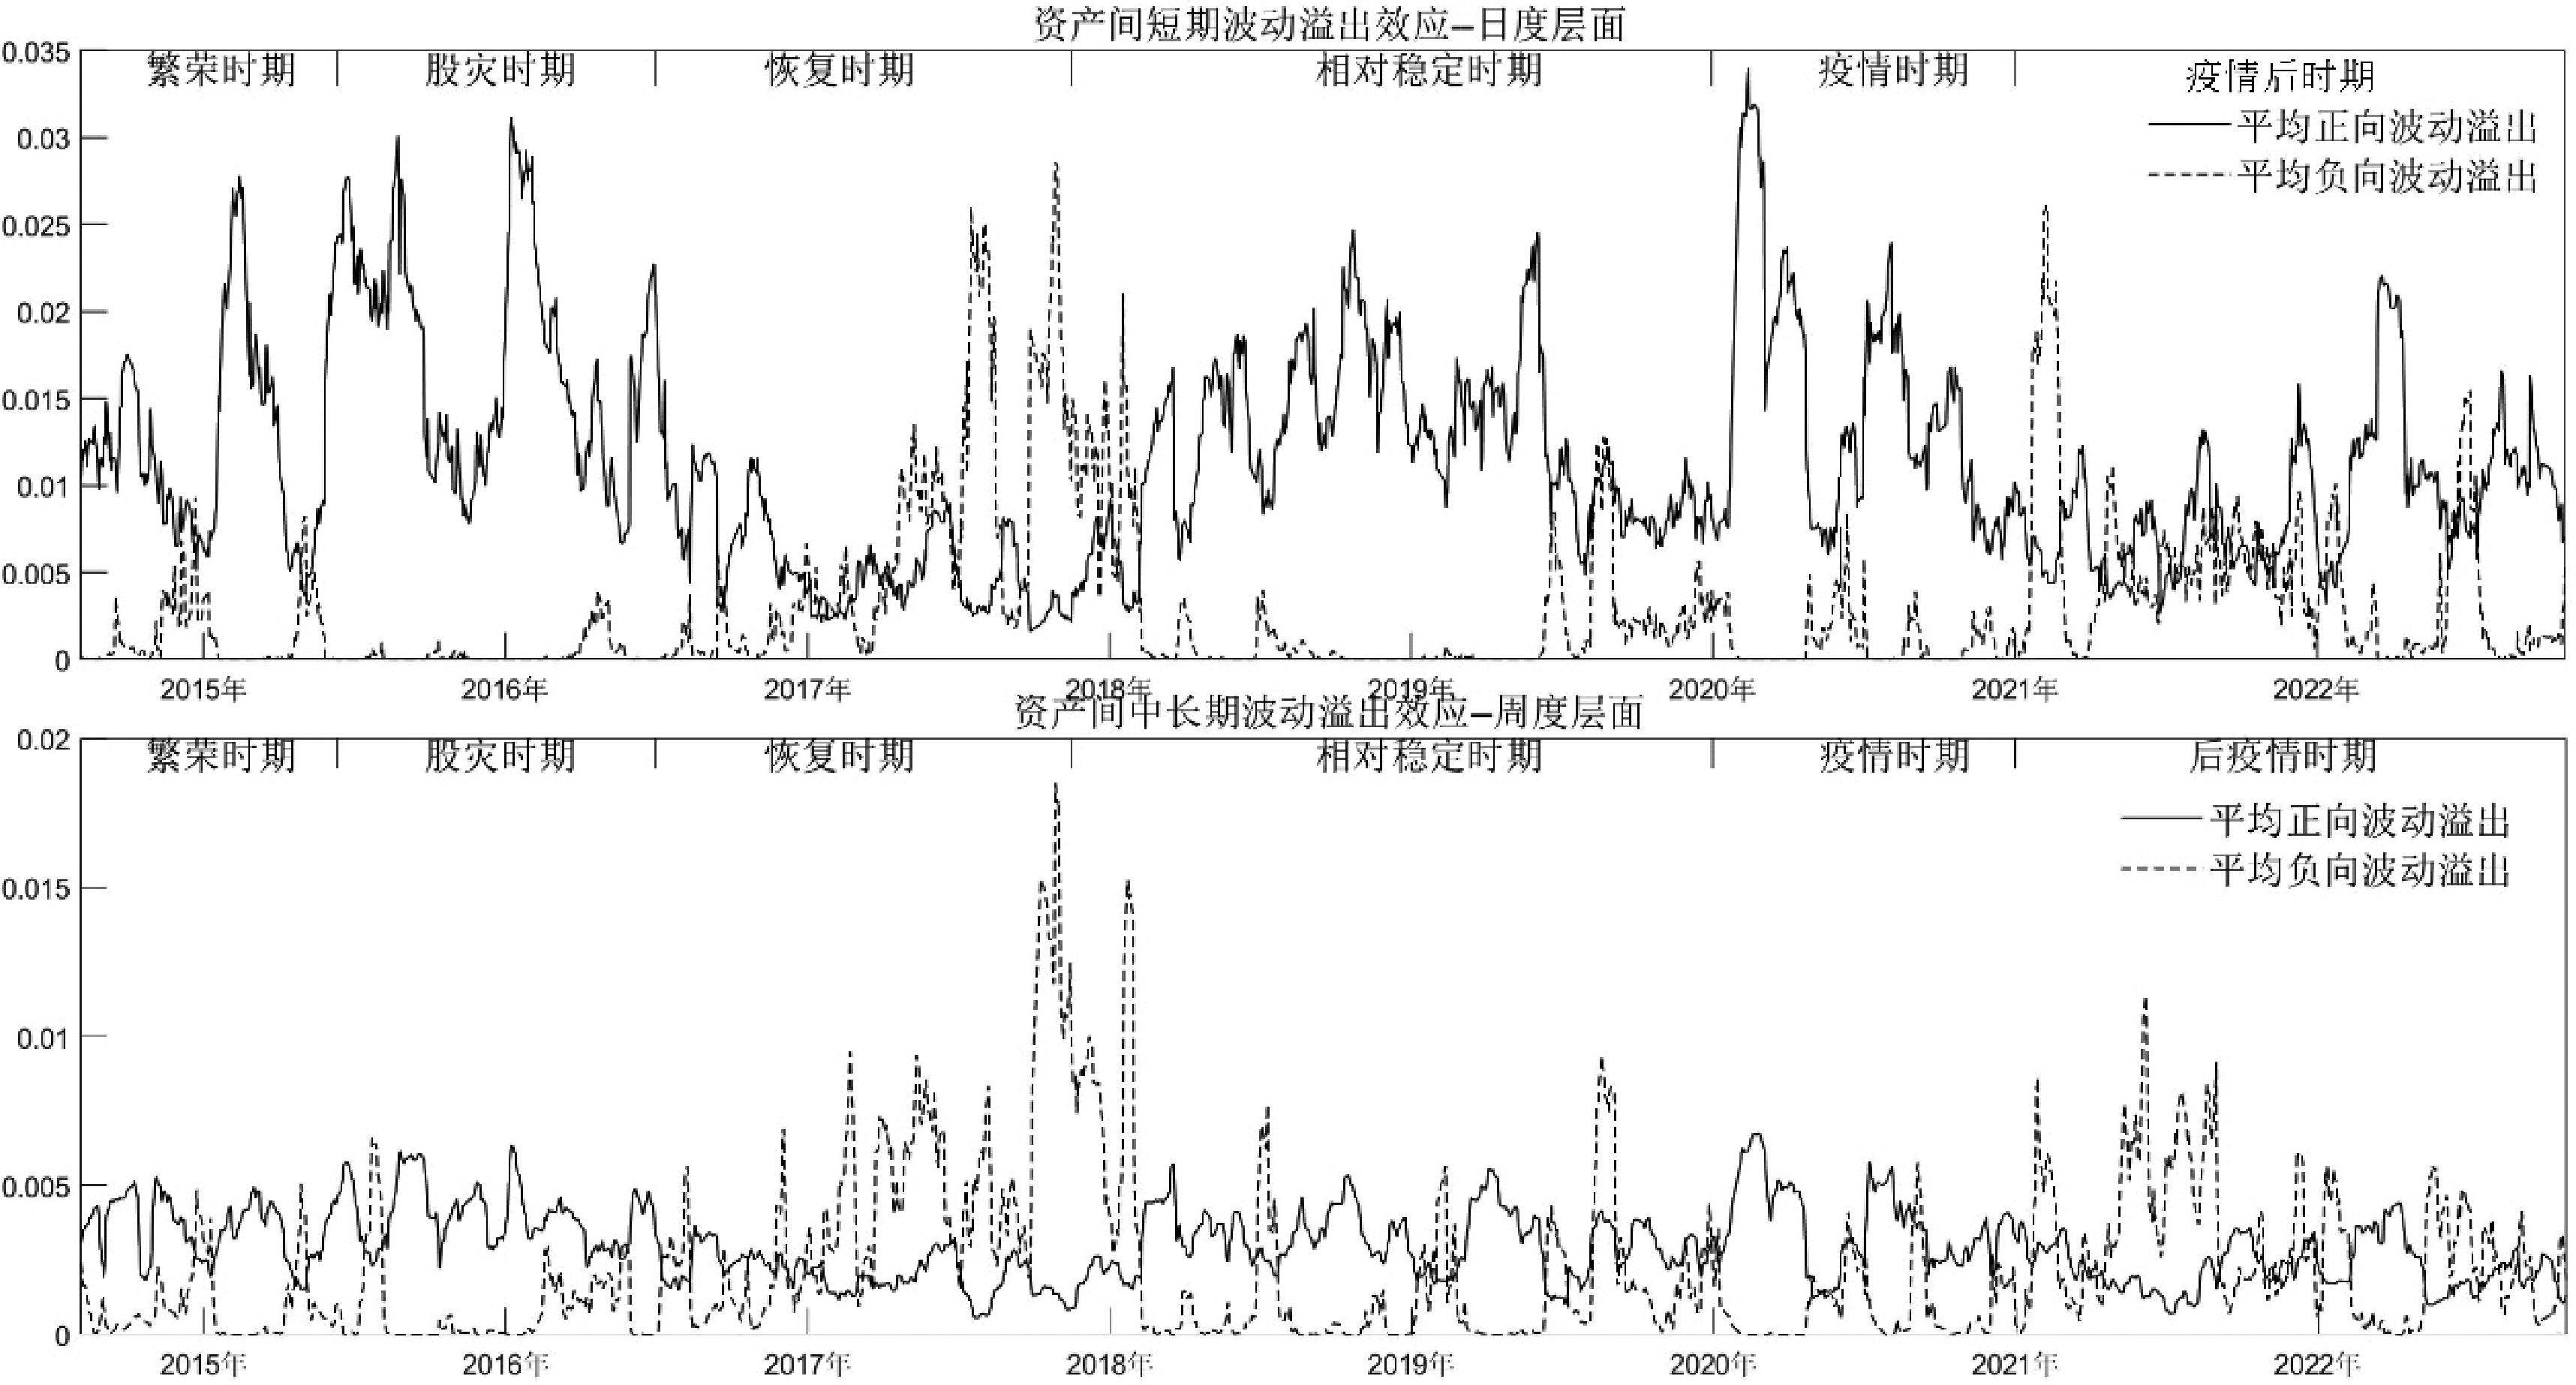
| 统计项 | Panel A:日度层面 | Panel B:周度层面 | ||||
|---|---|---|---|---|---|---|
平均正向波动溢出 | 平均负向波动溢出 | 合计 | 平均正向波动溢出 | 平均负向波动溢出 | 合计 | |
| 均值 | 0.0114 | 0.0029 | 0.0144 | 0.0029 | 0.0022 | 0.0052 |
| 标准差 | 0.0062 | 0.0047 | 0.0055 | 0.0012 | 0.0028 | 0.0023 |
| 变异系数 | 0.5431 | 1.5859 | 0.3795 | 0.4146 | 1.2557 | 0.4309 |
| 占比(%) | 79.53 | 20.47 | 100 | 57.13 | 42.87 | 100 |

"
"
| 模型 | 均方误差 ×10-3 | 逆矩阵的均方误差 ×106 | 均方误差×10-3 | 拟似然 损失 | 逆Stein 损失 | 无穷范数 ×10-3 | 2-范数 ×10-3 | 系数型参数数量 | 最优指标 | 平均排名 | |
|---|---|---|---|---|---|---|---|---|---|---|---|
| 方差 | 协方差 | ||||||||||
| CAW | 2.9144 | 2.25644 | 1.4194 | 2.4813 | -157.3204 | 49.5994 | 4.5794 | 2.4954 | 400 | 0 | 3.88 |
| HAR-CAW(1,5) | 2.9003 | 2.25063 | 1.3433 | 2.5154 | -158.3493 | 48.5413 | 4.5523 | 2.4933 | 800 | 0 | 3.13 |
| HAR-CAW(1,5,22) | 2.8572 | 2.24422 | 1.3211 | 2.4752 | -158.7511 | 48.0991 | 4.5072 | 2.4602 | 1200 | 3 | 1.63 |
| DNVM | 2.8291 | 2.24261 | 1.3342 | 2.4331 | -158.7392 | 48.1132 | 4.4631 | 2.4171 | 120 | 5 | 1.38 |
"
| 阶段 | 模型 | 均方误差 ×10-3 | 逆矩阵的均方误差×106 | 均方误差×10-3 | 拟似然损失 | 逆Stein'损失 | 无穷范数'×10-3 | 2-范数'×10-3 | 最优'指标 | 平均 排名 | |
|---|---|---|---|---|---|---|---|---|---|---|---|
| 方差 | 协方差 | ||||||||||
| 繁荣时期 | CAW | 5.1671 | 1.57234 | 2.4032 | 4.4831 | -144.6904 | 53.6494 | 7.9851 | 4.5011 | 4 | 2.25 |
| HAR-CAW(1,5) | 5.3832 | 1.54723 | 2.3241 | 4.7742 | -146.2481 | 51.6943 | 8.3772 | 4.6772 | 2 | 2.00 | |
| HAR-CAW(1,5,22) | 5.6594 | 1.44332 | 2.4263 | 5.0244 | -145.6803 | 51.1662 | 8.8184 | 4.9364 | 0 | 3.25 | |
| DNVM | 5.5213 | 1.42781 | 2.4704 | 4.8483 | -145.8842 | 50.7401 | 8.6703 | 4.7563 | 2 | 2.50 | |
| 股灾时期 | CAW | 7.2243 | 1.76744 | 2.9544 | 6.4813 | -144.5554 | 55.7304 | 11.4654 | 6.5953 | 0 | 3.63 |
| HAR-CAW(1,5) | 6.9572 | 1.76662 | 2.7862 | 6.2822 | -146.8623 | 53.4233 | 10.8331 | 6.3172 | 1 | 2.13 | |
| HAR-CAW(1,5,22) | 6.9421 | 1.76733 | 2.7661 | 6.2731 | -147.6161 | 52.6691 | 10.8462 | 6.2871 | 6 | 1.38 | |
| DNVM | 7.2794 | 1.76591 | 2.8773 | 6.5844 | -147.3522 | 52.9332 | 11.4073 | 6.6294 | 1 | 2.88 | |
| 恢复时期 | CAW | 1.5922 | 2.93514 | 0.9634 | 1.2302 | -162.3574 | 49.2464 | 2.4002 | 1.2662 | 0 | 3.00 |
| HAR-CAW(1,5) | 1.7224 | 2.93233 | 0.9163 | 1.4154 | -162.9943 | 48.6093 | 2.6144 | 1.4404 | 0 | 3.50 | |
| HAR-CAW(1,5,22) | 1.6353 | 2.92972 | 0.8792 | 1.3343 | -163.3911 | 48.2121 | 2.5043 | 1.3613 | 2 | 2.25 | |
| DNVM | 1.4261 | 2.92811 | 0.8501 | 1.1071 | -163.2952 | 48.3082 | 2.1931 | 1.1361 | 6 | 1.25 | |
| 平稳时期 | CAW | 1.8434 | 2.18894 | 0.9354 | 1.5644 | -160.6984 | 47.3774 | 2.8314 | 1.5034 | 0 | 4.00 |
| HAR-CAW(1,5) | 1.7753 | 2.18623 | 0.8693 | 1.5253 | -161.3753 | 46.7003 | 2.7653 | 1.4643 | 0 | 3.00 | |
| HAR-CAW(1,5,22) | 1.7282 | 2.18462 | 0.8401 | 1.4872 | -161.6131 | 46.4441 | 2.7182 | 1.4312 | 3 | 1.63 | |
| DNVM | 1.7151 | 2.18311 | 0.8492 | 1.4671 | -161.6212 | 46.4542 | 2.6601 | 1.3921 | 5 | 1.38 | |
| 疫情期间 | CAW | 1.7984 | 2.52414 | 0.9514 | 1.4914 | -163.4804 | 47.7694 | 2.9034 | 1.4884 | 0 | 4.00 |
| HAR-CAW(1,5) | 1.7253 | 2.52003 | 0.8863 | 1.4483 | -164.2813 | 46.9683 | 2.7953 | 1.4343 | 0 | 3.00 | |
| HAR-CAW(1,5,22) | 1.6741 | 2.51802 | 0.8591 | 1.4041 | -164.6541 | 46.5961 | 2.7381 | 1.4001 | 7 | 1.13 | |
| DNVM | 1.7172 | 2.51431 | 0.8812 | 1.4402 | -164.5982 | 46.6512 | 2.7622 | 1.4202 | 1 | 1.88 | |
| 后疫情期 | CAW | 2.2343 | 2.31194 | 1.3594 | 1.7062 | -159.3174 | 48.2994 | 3.7303 | 1.8173 | 0 | 3.38 |
| HAR-CAW(1,5) | 2.2724 | 2.30853 | 1.2773 | 1.8084 | -160.2423 | 47.3753 | 3.8264 | 1.8404 | 0 | 3.50 | |
| HAR-CAW(1,5,22) | 2.1822 | 2.30662 | 1.2552 | 1.7143 | -160.6871 | 46.9291 | 3.6812 | 1.7772 | 2 | 1.88 | |
| DNVM | 2.0601 | 2.30381 | 1.2351 | 1.5801 | -160.5972 | 47.0192 | 3.4671 | 1.6641 | 6 | 1.25 | |
"
| 模型 | 收益率 | 波动率 | 夏普率 | M2 | Δ1 | Δ5 | Δ10 | SR |
|---|---|---|---|---|---|---|---|---|
| CCC | 0.1634 | 17.2353 | -.1356 | - | - | - | - | - |
| DCC | 2.7685 | 17.1275 | .0157 | 260.684 | 261.441 | 262.058 | 262.199 | 49.98 |
| DECO | 2.7291 | 21.9635 | .0109 | 225.464 | 198.552 | 178.476 | 173.914 | 48.09 |
| BEKK | 3.4110 | 19.9412 | .0462 | 292.923 | 288.267 | 282.364 | 281.023 | 51.46 |
| CAW | 4.1480 | 18.1776 | .0907 | 368.405 | 366.378 | 360.863 | 359.609 | 50.50 |
| HAR-CAW(1,5) | 3.6231 | 17.5028 | .0642 | 354.728 | 354.076 | 352.722 | 352.414 | 51.80 |
| HAR-CAW(1,5,22) | 4.6646 | 17.8792 | .1211 | 463.994 | 466.006 | 462.568 | 461.787 | 51.35 |
| DNVM | 5.1631 | 16.9077 | .1575 | 522.151 | 518.877 | 521.154 | 521.673 | 51.82 |
| 纠偏DNVM | 7.2451 | 17.8552 | .2658 | 692.428 | 702.197 | 698.980 | 698.249 | 52.37 |
"
| 统计项 | |||||||
|---|---|---|---|---|---|---|---|
| 平均值 | 0.4197 | 0.4784 | -0.1532 | 0.4219 | 0.5464 | -0.2473 | 0.2076 |
| 最大值 | 0.9945 | 0.9945 | -1.26×10⁻⁵ | 0.9966 | 0.9966 | -1.06×10⁻⁶ | 1.2377 |
| 最小值 | -0.8184 | 1.62×10⁻⁷ | -0.8184 | -0.9059 | 1.52×10⁻⁷ | -0.9059 | 6.17×10⁻⁷ |
| 标准差 | 0.2903 | 0.2329 | 0.1256 | 0.3794 | 0.2562 | 0.1844 | 0.1701 |
"
| — | ||||||
|---|---|---|---|---|---|---|
| 矩阵F分布 | 0.2212 | 0.7759 | 1.8214 | 0.0581 | 0.4114 | 2.8708 |
| Wishart分布 | 0.2217 | 0.7763 | 1.8523 | 0.0626 | 0.4220 | 2.9043 |
"
| 模型 | 均方误差 ×10-3 | 逆矩阵的均方 误差×106 | 均方误差×10-3 | 拟似然损失 | 逆Stein 损失 | 无穷范数 ×10-3 | 2-范数 ×10-3 | 系数型参数数量 | 最优指标 | 平均排名 | |
|---|---|---|---|---|---|---|---|---|---|---|---|
| 方差 | 协方差 | ||||||||||
| CAF | 2.6164 | 2.28604 | 1.3204 | 2.1972 | -156.9034 | 50.5754 | 4.1614 | 2.2704 | 400 | 0 | 3.75 |
| HAR-CAF(1,5) | 2.5903 | 2.27713 | 1.2193 | 2.2294 | -158.2843 | 49.1703 | 4.1573 | 2.2313 | 800 | 0 | 3.13 |
| HAR-CAF(1,5,22) | 2.5732 | 2.27272 | 1.2162 | 2.2113 | -158.6492 | 48.7752 | 4.1252 | 2.2242 | 1200 | 0 | 2.13 |
| DNVM-F | 2.5261 | 2.27071 | 1.2121 | 2.1571 | -158.7061 | 48.7221 | 4.0681 | 2.1691 | 120 | 6 | 1 |
"
| 模型 | 收益率 | 波动率 | 夏普率 | M2 | Δ1 | Δ5 | Δ10 | SR |
|---|---|---|---|---|---|---|---|---|
| CAF | 6.486 | 17.467 | 0.228 | 332.938 | 282.493 | 307.322 | 312.965 | 51.94 |
| HAR-CAF(1,5) | 6.010 | 17.154 | 0.205 | 286.856 | 241.591 | 268.358 | 274.441 | 50.95 |
| HAR-CAF(1,5,22) | 6.808 | 17.020 | 0.253 | 458.664 | 390.321 | 418.133 | 424.454 | 51.02 |
| DNVM-F | 6.822 | 16.905 | 0.256 | 481.187 | 409.588 | 438.132 | 444.619 | 50.96 |
| 纠偏DNVM-F | 7.579 | 18.570 | 0.274 | 501.511 | 452.737 | 471.429 | 475.678 | 52.16 |
| [1] | 熊正德, 文慧, 熊一鹏. 我国外汇市场与股票市场间波动溢出效应实证研究——基于小波多分辨的多元BEKK-GARCH(1, 1)模型分析[J]. 中国管理科学, 2015, 23(4): 30-38. |
| Xiong Z D, Wen H, Xiong Y P. Empirical research on spillover effect between foreign exchange market and stock market by wavelet multi-resolution analysis and multivariate BEKK-GARCH(1, 1)model[J]. Chinese Journal of Management Science, 2015, 23(4): 30-38. | |
| [2] | Bollerslev T. Modelling the coherence in short-Run nominal exchange rates: A multivariate generalized arch model[J]. The Review of Economics and Statistics, 1990, 72(3): 498-505. |
| [3] | 赵钊. 高维条件协方差矩阵的非线性压缩估计及其在构建最优投资组合中的应用[J]. 中国管理科学, 2017, 25(8): 46-57. |
| Zhao Z. Nonlinear shrinkage estimation of high dimensional conditional covariance matrix and its application in portfolio selection[J]. Chinese Journal of Management Science, 2017, 25(8): 46-57. | |
| [4] | Harvey A, Ruiz E, Shephard N. Multivariate stochastic variance models[J]. The Review of Economic Studies, 1994, 61(2): 247-264. |
| [5] | 周艳丽, 刘诗璨, 葛翔宇. 快速随机波动率变换下的信用风险定价研究[J]. 中国管理科学,2016,24(S1): 509-518. |
| Zhou Y L, Liu S C, Ge X Y. The study on the pricing of credit risk under the fast stochastic volatility[J]. Chinese Journal of Management Science, 2016, 24(S1): 509-518. | |
| [6] | 刘广应, 包悦妍, 林金官. 基于金融高频数据的LASSO-CDRD协方差矩阵预测模型[J]. 统计研究, 2022, 39(9): 145-160. |
| Liu G Y, Bao Y Y, Lin J G. LASSO-CDRD covariance matrix prediction model based on high frequency financial data[J]. Statistical Research, 2022, 39(9): 145-160. | |
| [7] | 罗嘉雯, 陈浪南. 基于TVS-MHAR模型金融市场高频多元波动率的预测[J]. 系统工程理论与实践, 2018, 38(7): 1677-1689. |
| Luo J W, Chen L N. Multivariate realized volatility forecasts of financial markets based on TVS-MHAR model[J]. Systems Engineering-Theory & Practice, 2018, 38(7): 1677-1689. | |
| [8] | 鲁万波, 亢晶浩. GAS-SKST-F模型及其在高频多元波动率预测中的应用[J]. 中国管理科学, 2022, 30(1): 77-87+290. |
| Lu W B, Kang J H. GAS-SKST-F model and its application in high frequency multivariate volatility forecast[J]. Chinese Journal of Management Science, 2022, 30(1): 77-87+290. | |
| [9] | Bollerslev T, Patton A J, Quaedvlieg R. Multivariate leverage effects and realized semicovariance GARCH models[J]. Journal of Econometrics, 2020, 217(2): 411-430. |
| [10] | Golosnoy V, Gribisch B, Liesenfeld R. The conditional autoregressive Wishart model for multivariate stock market volatility[J]. Journal of Econometrics, 2012, 167(1): 211-223. |
| [11] | 赵树然, 米月, 任培民. 群体分析视角下商业银行对金融体系的风险溢出效应研究[J]. 统计研究, 2018, 35(3): 52-65. |
| Zhao S R, Mi Y, Ren P M. Analysis on risk spillover effects of commercial banks on financial system from a group perspective[J]. Statistical Research, 2018, 35(3): 52-65. | |
| [12] | Zhu X, Pan R, Li G, et al. Network vector autoregression[J]. The Annals of Statistics, 2017, 45(3): 1096-1123. |
| [13] | Ando T, Li K, Lu L. A spatial panel quantile model with unobserved heterogeneity[J]. Journal of Econometrics, 2023, 232(1): 191-213. |
| [14] | Lan W, Fang Z, Wang H, et al. Covariance matrix estimation via network structure[J]. Journal of Business & Economic Statistics, 2018, 36(2): 359-369. |
| [15] | Zou T, Lan W, Wang H, et al. Covariance regression analysis[J]. Journal of the American Statistical Association, 2017, 112(517): 266-281. |
| [16] | Zhou J, Li D, Pan R, et al. Network GARCH model[J]. Statistica Sinica, 2020,30(4): 1723-1740. |
| [17] | Zhu X, Wang W, Wang H, et al. Network quantile autoregression[J]. Journal of Econometrics, 2019, 212(1): 345-358. |
| [18] | Caporin M, Paruolo P. Proximity-structured multivariate volatility models[J]. Econometric Reviews, 2015, 34(5): 559-593. |
| [19] | Yu P L H, Li W K, Ng F C. The generalized conditional autoregressive wishart model for multivariate realized volatility[J]. Journal of Business & Economic Statistics, 2017, 35(4): 513-527. |
| [20] | Corsi F. A simple approximate long-memory model of realized volatility[J]. Journal of Financial Econometrics, 2009, 7(2): 174-196. |
| [21] | 莫东序, 郑田丹. 基于复杂网络的投资组合优化研究[J]. 中国管理科学, 2021, 29(5): 25-33. |
| Mo D X, Zheng T D. Research on portfolio optimization based on complex network[J]. Chinese Journal of Management Science, 2021, 29(5): 25-33. | |
| [22] | Chen C Y, Härdle W K, Okhrin Y. Tail event driven networks of SIFIs[J]. Journal of Econometrics, 2019, 208(1): 282-298. |
| [23] | 杨子晖, 张平淼, 陈雨恬. 风险共振还是风险分散?——基于尾部事件下风险结构的关联研究[J]. 经济学(季刊), 2021, 21(6): 2127-2152. |
| Yang Z H, Zhang P M, Chen Y T. Risk co-movement or risk diversification?Research on connectedness of risk profile under tail events[J]. China Economic Quarterly, 2021, 21(6): 2127-2152. | |
| [24] | Zolfaghari M, Ghoddusi H, Faghihian F. Volatility spillovers for energy prices: A diagonal BEKK approach[J]. Energy Economics, 2020, 92: 104965. |
| [25] | Fang L, Sun B, Li H, et al. Systemic risk network of Chinese financial institutions[J]. Emerging Markets Review, 2018, 35: 190-206. |
| [26] | 赵树然, 姜亚萍, 任培民. 高频波动率矩阵估计的比较分析——基于有噪非同步的金融数据[J]. 中国管理科学, 2015, 23(10): 19-29. |
| Zhao S R, Jiang Y P, Ren P M. Comparing estimators of the high-frequency volatility matrix in the presence of non-synchronous trading and market microstructure noise[J]. Chinese Journal of Management Science, 2015, 23(10): 19-29. | |
| [27] | Shigemoto H, Morimoto T. An integrated framework for visualizing and forecasting realized covariance matrices[J]. Japanese Journal of Statistics and Data Science, 2021, 4(1): 577-599. |
| [28] | Cui X, Zhang X. Index tracking strategy based on mixed-frequency financial data[J]. PLoS One, 2021, 16(4): e0249665. |
| [29] | Haff L R. Estimation of the inverse covariance matrix: Random mixtures of the inverse wishart matrix and the identity[J]. The Annals of Statistics, 1979, 7(6): 1264-1276. |
| [30] | Engle R. Dynamic conditional correlation: A simple class of multivariate generalized autoregressive conditional heteroskedasticity models[J]. Journal of Business & Economic Statistics, 2002, 20(3): 339-350. |
| [31] | Engle R F, Kroner K F. Multivariate simultaneous generalized arch[J]. Econometric Theory, 1995, 11(1): 122-150. |
| [32] | Engle R, Kelly B. Dynamic equicorrelation[J]. Journal of Business & Economic Statistics, 2012, 30(2): 212-228. |
| [33] | 赵树然, 任培民, 赵昕. 基于CARR-EVT整体方法的动态日VaR和CVaR模型研究[J]. 数量经济技术经济研究, 2012, 29(11): 130-148. |
| Zhao S R, Ren P M, Zhao X. Modeling daily VaR and CVaR by integrating CARR and EVT models[J]. The Journal of Quantitative & Technical Economics, 2012, 29(11): 130-148. | |
| [34] | Opschoor A, Janus P, Lucas A, et al. New HEAVY models for fat-tailed realized covariances and returns[J]. Journal of Business & Economic Statistics, 2018, 36(4): 643-657. |
| [1] | Wenyang Wu,Hai Jiang,Shenfeng Tang. Digital Transformation, Network Relevance and Banking Systemic Risk [J]. Chinese Journal of Management Science, 2024, 32(3): 9-19. |
| [2] | XIONG Zheng-de, WEN Hui, XIONG Yi-peng. Empirical Research on Spillover Effect between Foreign Exchange Market and Stock Market by Wavelet Multi-resolution Analysis and Multivariate BEKK-GARCH(1,1) Model [J]. Chinese Journal of Management Science, 2015, 23(4): 30-38. |
| [3] | XIONG Zheng de, HAN Li jun. An Empirical Study on the Volatility Spillover Effect between Financial Markets——GC-MSV Model and Application [J]. Chinese Journal of Management Science, 2013, (2): 32-41. |
| Viewed | ||||||
|
Full text |
|
|||||
|
Abstract |
|
|||||
|
||