主管:中国科学院
主办:中国优选法统筹法与经济数学研究会
中国科学院科技战略咨询研究院
主办:中国优选法统筹法与经济数学研究会
中国科学院科技战略咨询研究院
中国管理科学 ›› 2026, Vol. 34 ›› Issue (1): 28-40.doi: 10.16381/j.cnki.issn1003-207x.2023.1116cstr: 32146.14.j.cnki.issn1003-207x.2023.1116
吴鑫育1( ), 朱志田1, 马超群2
收稿日期:2023-07-04
修回日期:2024-01-16
出版日期:2026-01-25
发布日期:2026-01-29
通讯作者:
吴鑫育
E-mail:xywu@aufe.edu.cn
基金资助:
Xinyu Wu1(), Zhitian Zhu1, Chaoqun Ma2
Received:2023-07-04
Revised:2024-01-16
Online:2026-01-25
Published:2026-01-29
Contact:
Xinyu Wu
E-mail:xywu@aufe.edu.cn
摘要:
本文构建了已实现SV-MIDAS(RSV-MIDAS)模型框架,将经济政策不确定性(EPU)引入其中,实证分析了EPU对中国股市波动率的影响以及预测作用。为了估计RSV-MIDAS模型的参数,本文提出基于连续粒子滤波的极大似然估计方法,并利用蒙特卡罗模拟实验验证了该估计方法的有效性。采用月度中国EPU指数和日内高频上证综合指数与深证成分指数价格数据,对引入EPU的RSV-MIDAS(RSV-MIDAS-EPU)模型进行实证研究,结果表明:EPU对中国股市长期波动率具有显著的负向影响,即EPU水平提高,预期中国股市长期波动率会下降;EPU对股市长期波动率的影响相比月度已实现波动率(RV)对股市长期波动率的影响持续时间更长。利用多种损失函数和模型置信集(MCS)检验作为判断准则,实证比较了RSV-MIDAS-EPU模型与其他竞争模型对中国股市波动率的样本外预测能力,结果表明:已实现测度和EPU对于中国股市波动率预测具有重要作用;RSV-MIDAS-EPU模型具有更优越的波动率预测能力。最后,通过波动率择时策略分析发现,RSV-MIDAS-EPU模型能够获得更高的投资组合经济价值。
中图分类号:
吴鑫育,朱志田,马超群. 经济政策不确定性与中国股市波动率——基于已实现SV-MIDAS模型的实证研究[J]. 中国管理科学, 2026, 34(1): 28-40.
Xinyu Wu,Zhitian Zhu,Chaoqun Ma. Economic Policy Uncertainty and Chinese Stock Market Volatility: A Realized SV-MIDAS Approach[J]. Chinese Journal of Management Science, 2026, 34(1): 28-40.
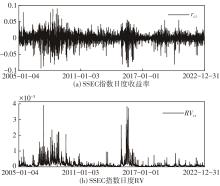
图1
SSEC指数日度收益率和RV的时间序列"
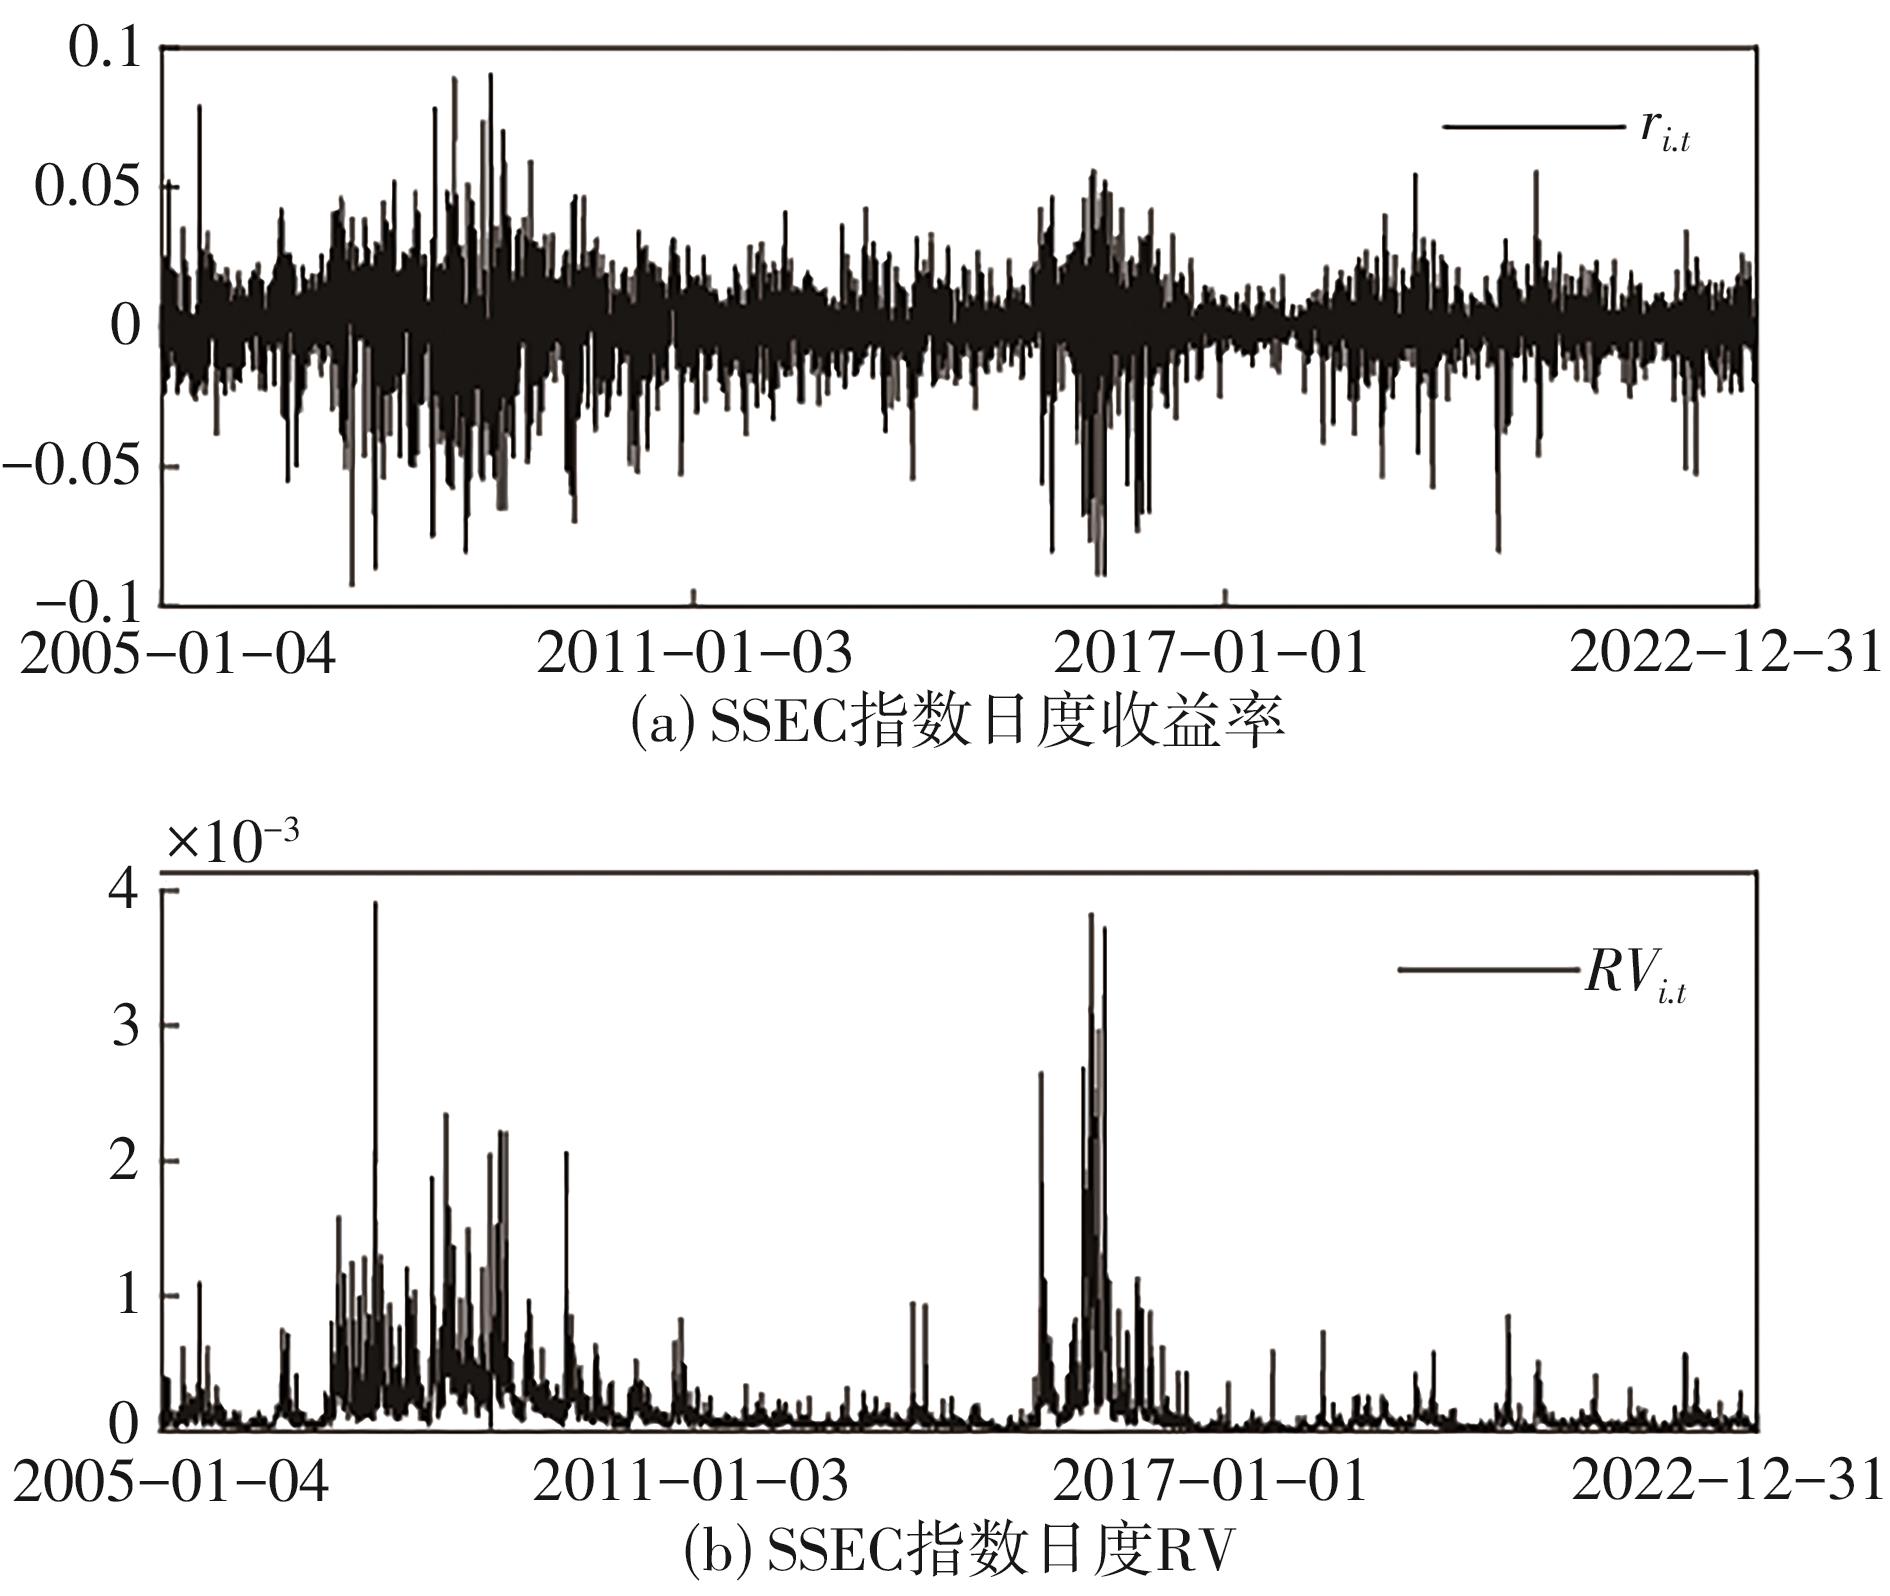
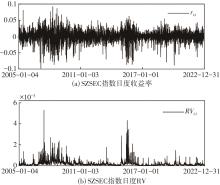
图2
SZSEC指数日度收益率和RV的时间序列"

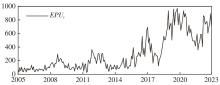
图3
中国EPU指数的时间序列"

表1
描述性统计量"
| 观测变量 | 均值 | 最小值 | 最大值 | 标准差 | 偏度 | 峰度 | Jarque-Bera | Q(10) |
|---|---|---|---|---|---|---|---|---|
| SSEC(日度) | ||||||||
| 0.0002 | -0.0926 | 0.0903 | 0.0155 | -0.5808 | 7.9211 | 4658.4755 | 37.6847 | |
| 0.0002 | 0.0000 | 0.0039 | 0.0003 | 6.0055 | 58.6474 | 590517.3214 | 10586.6970 | |
| -9.3737 | -12.0260 | -5.5450 | 1.0262 | 0.5530 | 3.0746 | 223.8753 | 23189.0082 | |
| SZSEC(日度) | ||||||||
| 0.0003 | -0.0975 | 0.0916 | 0.0180 | -0.5045 | 6.1537 | 1997.2329 | 33.1335 | |
| 0.0002 | 0.0000 | 0.0053 | 0.0003 | 5.7511 | 56.7239 | 549880.496 | 8780.2091 | |
| -8.9776 | -11.8412 | -5.2414 | 0.9506 | 0.3732 | 3.1590 | 106.0759 | 20829.5662 | |
| EPU(月度) | ||||||||
| 300.8117 | 26.1441 | 970.8299 | 259.1049 | 1.0299 | 2.8242 | 38.4605 | 1431.2967 | |
表2
模型参数估计结果:SSEC"
| 参数 | SV | SV-MIDAS | SV-MIDAS-EPU | RSV | RSV-MIDAS | SV-MIDAS-EPU |
|---|---|---|---|---|---|---|
0.0004 (0.0002) | 0.0004 (0.0002) | 0.0004 (0.0002) | 0.0006 (0.0002) | 0.0007 (0.0002) | 0.0007 (0.0002) | |
0.9812 (0.0022) | 0.7423 (0.0095) | 0.7197 (0.0121) | 0.9597 (0.0020) | 0.8909 (0.0026) | 0.8810 (0.0027) | |
-0.1340 (0.0021) | -0.2802 (0.0132) | -0.2837 (0.0142) | -0.1236 (0.0030) | -0.1249 (0.0033) | -0.1370 (0.0044) | |
0.0345 (0.0021) | 0.2638 (0.0111) | 0.2888 (0.0113) | 0.0758 (0.0016) | 0.0947 (0.0019) | 0.0983 (0.0026) | |
-0.4878 (0.0023) | -0.4793 (0.0038) | -0.4807 (0.0034) | ||||
0.1475 (0.0014) | 0.1352 (0.0019) | 0.1324 (0.0023) | ||||
-8.7572 (0.0319) | -3.8344 (0.0387) | -3.4867 (0.0362) | -8.8387 (0.0187) | -3.8623 (0.0105) | -3.3634 (0.0154) | |
0.8168 (0.0077) | 0.7751 (0.0079) | 0.8069 (0.0031) | 0.7327 (0.0034) | |||
50.3629 (0.5494) | 53.5083 (0.8811) | 11.9543 (0.0438) | 13.4135 (0.0679) | |||
-0.1182 (0.0096) | -0.1865 (0.0041) | |||||
1.7496 (0.0294) | 2.6286 (0.0124) | |||||
| LL | 12837.8280 | 12873.8355 | 12877.2411 | 9722.1722 | 9764.2776 | 9769.4491 |
| AIC | -25665.6560 | -25733.6710 | -25736.4821 | -19430.3445 | -19510.5552 | -19516.8982 |
| VR | 0.5720 | 0.5828 | 0.3566 | 0.3782 |
表3
模型参数估计结果:SZSEC"
| 参数 | SV | SV-MIDAS | SV-MIDAS-EPU | RSV | RSV-MIDAS | SV-MIDAS-EPU |
|---|---|---|---|---|---|---|
0.0004 (0.0002) | 0.0004 (0.0002) | 0.0004 (0.0002) | 0.0007 (0.0002) | 0.0008 (0.0002) | 0.0008 (0.0002) | |
0.9780 (0.0022) | 0.7933 (0.0106) | 0.7886 (0.0090) | 0.9509 (0.0009) | 0.8894 (0.0028) | 0.8831 (0.0031) | |
-0.2187 (0.0028) | -0.3246 (0.0138) | -0.3326 (0.0152) | -0.1012 (0.0023) | -0.1484 (0.0033) | -0.1614 (0.0053) | |
0.0295 (0.0022) | 0.1705 (0.0105 | 0.1742 (0.0112) | 0.0693 (0.0011) | 0.0880 (0.0020) | 0.0888 (0.0024) | |
-0.5231 (0.0025) | -0.5183 (0.0031) | -0.5104 (0.0028) | ||||
0.1543 (0.0017) | 0.1384 (0.0022) | 0.1375 (0.0025) | ||||
-8.3673 (0.0229) | -4.2103 (0.0428) | -3.9153 (0.0369) | -8.4585 (0.0156) | -3.2414 (0.0090) | -3.1236 (0.0123) | |
0.7275 (0.0078) | 0.6788 (0.0081) | 0.8907 (0.0032) | 0.7942 (0.0028) | |||
50.9761 (0.6597) | 57.3567 (0.6863) | 10.7585 (0.0406) | 12.9766 (0.0585) | |||
-0.1121 (0.0091) | -0.1348 (0.0031) | |||||
1.5078 (0.0300) | 1.0430 (0.0036) | |||||
| LL | 11933.3740 | 11965.1096 | 11967.4208 | 8843.6231 | 8882.9981 | 8888.5138 |
| AIC | -23856.7479 | -23916.2193 | -23916.8416 | -17673.2461 | -17747.9962 | -17755.0275 |
| VR | 0.5221 | 0.5290 | 0.4337 | 0.4262 |
表4
波动率预测评价结果"
| 损失函数 | SV | SV-MIDAS | SV-MIDAS-EPU | RSV | RSV-MIDAS | RSV-MIDAS-EPU |
|---|---|---|---|---|---|---|
| SSEC | ||||||
| MSE | 1.6594e-05 | 1.3307e-05 | 9.1665e-06 | 1.1129e-05 | 9.3453e-06 | 8.0625e-06 |
| MAE | 3.3818e-03 | 3.0173e-03 | 2.3635e-03 | 2.6873e-03 | 2.5091e-03 | 2.2914e-03 |
| HMSE | 1.2140e-01 | 1.2499e-01 | 1.1270e-01 | 9.1588e-02 | 8.7407e-02 | 8.0637e-02 |
| HMAE | 3.0959e-01 | 3.0058e-01 | 2.6582e-01 | 2.6351e-01 | 2.5608e-01 | 2.4177e-01 |
| QLIKE | -3.8486e+00 | -3.8547e+00 | -3.8743e+00 | -3.8735e+00 | -3.8775e+00 | -3.8836e+00 |
| SZSEC | ||||||
| MSE | 2.7298e-05 | 2.3157e-05 | 1.5792e-05 | 1.8786e-05 | 1.5599e-05 | 1.4257e-05 |
| MAE | 4.4718e-03 | 4.1064e-03 | 3.1944e-03 | 3.5499e-03 | 3.2899e-03 | 3.1104e-03 |
| HMSE | 1.1776e-01 | 1.1978e-01 | 1.0253e-01 | 8.7319e-02 | 8.2955e-02 | 7.8664e-02 |
| HMAE | 3.0849e-01 | 3.0179e-01 | 2.5989e-01 | 2.5971e-01 | 2.5127e-01 | 2.4204e-01 |
| QLIKE | -3.5551e+00 | -3.5592e+00 | -3.5791e+00 | -3.5792e+00 | -3.5834e+00 | -3.5870e+00 |
表5
投资组合的业绩表现(年化基点费用)"
| 模型 | SSEC | SZSEC | ||||
|---|---|---|---|---|---|---|
| SV-MIDAS | 11.5929 | 5.7936 | 3.8605 | 49.1700 | 24.5819 | 16.3858 |
| SV-MIDAS-EPU | 107.7203 | 53.8616 | 35.9088 | 163.1659 | 81.5837 | 54.3897 |
| RSV | 199.9720 | 99.9863 | 66.6577 | 92.8914 | 46.4480 | 30.9669 |
| RSV-MIDAS | 222.1463 | 111.0729 | 74.0485 | 130.0143 | 65.0071 | 43.3380 |
| RSV-MIDAS-EPU | 257.7694 | 128.8857 | 85.9245 | 177.0980 | 88.5499 | 59.0339 |
| [1] | Bollerslev T. Generalized autoregressive conditional heteroskedasticity[J]. Journal of Econometrics, 1986, 31(3): 307-327. |
| [2] | Taylor S J. Modeling stochastic volatility: A review and comparative study[J]. Mathematical Finance, 1994, 4(2): 183-204. |
| [3] | Yu J. On leverage in a stochastic volatility model[J]. Journal of Econometrics, 2005, 127(2): 165-178. |
| [4] | Andersen T G, Bollerslev T, Diebold F X, et al. The distribution of realized stock return volatility[J]. Journal of Financial Economics, 2001, 61(1): 43-76. |
| [5] | 刘广应, 包悦妍, 林金官. 基于金融高频数据的LASSO-CDRD协方差矩阵预测模型[J]. 统计研究, 2022, 39(9): 145-160. |
| Liu G Y, Bao Y Y, Lin J G. LASSO-CDRD covariance matrix prediction model based on high frequency financial data[J]. Statistical Research, 2022, 39(9): 145-160. | |
| [6] | Barndorff-Nielsen O E, Shephard N. Econometric analysis of realized volatility and its use in estimating stochastic volatility models[J]. Journal of the Royal Statistical Society Series B (Statistical Methodology), 2002, 64(2): 253-280. |
| [7] | Takahashi M, Omori Y, Watanabe T. Estimating stochastic volatility models using daily returns and realized volatility simultaneously[J]. Computational Statistics & Data Analysis, 2009, 53(6): 2404-2426. |
| [8] | 吴鑫育, 周海林. 基于已实现SV模型的动态VaR测度研究[J]. 管理工程学报, 2018, 32(2): 144-150. |
| Wu X Y, Zhou H L. Study on dynamic VaR measures based on realized SV model[J]. Journal of Industrial Engineering and Engineering Management, 2018, 32(2): 144-150. | |
| [9] | 吴鑫育, 李心丹, 马超群. 双因子非对称已实现SV模型及其实证研究[J]. 中国管理科学, 2018, 26(2): 1-13. |
| Wu X Y, Li X D, Ma C Q. Two-factor asymmetric realized SV model and its empirical test[J]. Chinese Journal of Management Science, 2018, 26(2): 1-13. | |
| [10] | 吴鑫育, 李心丹, 马超群. 混合正态双因子已实现SV模型及其实证研究[J]. 管理科学, 2019, 32(2): 148-160. |
| Wu X Y, Li X D, Ma C Q. Two-factor realized SV model with mixture of normals and its empirical research[J]. Journal of Management Science, 2019, 32(2): 148-160. | |
| [11] | Wu X, Wang X. Forecasting volatility using realized stochastic volatility model with time-varying leverage effect[J]. Finance Research Letters, 2020, 34: 101271. |
| [12] | Zhang Z, Zhao R. Improving the asymmetric stochastic volatility model with ex-post volatility: The identification of the asymmetry[J]. Quantitative Finance, 2023, 23(1): 35-51. |
| [13] | 张波, 蒋远营. 基于中国股票高频交易数据的随机波动建模与应用[J]. 统计研究, 2017, 34(3): 107-117. |
| Zhang B, Jiang Y Y. Stochastic volatility modeling based on high-frequency Chinese stock-market transaction data and applications[J]. Statistical Research, 2017, 34(3): 107-117. | |
| [14] | Asai M, Chang C L, McAleer M. Realized matrix-exponential stochastic volatility with asymmetry, long memory and higher-moment spillovers[J]. Journal of Econometrics, 2022, 227(1): 285-304. |
| [15] | Baker S R, Bloom N, Davis S J. Measuring economic policy uncertainty[J]. The Quarterly Journal of Economics, 2016, 131(4): 1593-1636. |
| [16] | 杨子晖, 陈里璇, 陈雨恬. 经济政策不确定性与系统性金融风险的跨市场传染——基于非线性网络关联的研究[J]. 经济研究, 2020, 55(1): 65-81. |
| Yang Z H, Chen L X, Chen Y T. Cross-market contagion of economic policy uncertainty and systemic financial risk: A nonlinear network connectedness analysis[J]. Economic Research Journal, 2020, 55(1): 65-81. | |
| [17] | 钟婉玲, 李海奇. 国际油价、宏观经济变量与中国股市的尾部风险溢出效应研究[J]. 中国管理科学, 2022, 30(2): 27-37. |
| Zhong W L, Li H Q. Tail risk spillover effects among crude oil price, macroeconomic variables and China’s stock market[J]. Chinese Journal of Management Science, 2022, 30(2): 27-37. | |
| [18] | 王正新, 姚培毅. 中国经济政策不确定性的跨国动态溢出效应[J]. 中国管理科学, 2019, 27(5): 78-85. |
| Wang Z X, Yao P Y. Dynamic spillovers effects of economic policy uncertainty of China[J]. Chinese Journal of Management Science, 2019, 27(5): 78-85. | |
| [19] | 张喜艳, 陈乐一. 经济政策不确定性的溢出效应及形成机理研究[J]. 统计研究, 2019, 36(1): 115-128. |
| Zhang X Y, Chen L Y. A study on the spillover effect and its formation mechanism of economic policy uncertainty[J]. Statistical Research, 2019, 36(1): 115-128. | |
| [20] | 胡成春, 陈迅. 经济政策不确定性、宏观经济与资产价格波动——基于TVAR模型及溢出指数的实证分析[J]. 中国管理科学, 2020, 28(11): 61-70. |
| Hu C C, Chen X. Economic policy uncertainty, macroeconomic and asset price fluctuation: Based on TVAR model and spillover index[J]. Chinese Journal of Management Science, 2020, 28(11): 61-70. | |
| [21] | 吴鑫育, 谢海滨, 马超群. 经济政策不确定性与人民币汇率波动率——基于CARR-MIDAS模型的实证研究[J]. 中国管理科学, 2024,32(8):1-14. |
| Wu X Y, Xie H B, Ma C Q. Economic policy uncertainty and renminbi exchange rate volatility: Evidence from CARR-MIDAS model[J]. Chinese Journal of Management Science, 2024,32(8):1-14. | |
| [22] | 张宗新, 林弘毅, 李欣越. 经济政策不确定性如何影响金融市场间的流动性协同运动?——基于中国金融周期的视角[J]. 统计研究, 2020, 37(2): 37-51. |
| Zhang Z X, Lin H Y, Li X Y. How economic policy uncertainty affects liquidity co-movements among financial markets:From the perspective of China’s financial cycle[J]. Statistical Research, 2020, 37(2): 37-51. | |
| [23] | Ghysels E, Sinko A, Valkanov R. MIDAS regressions: Further results and new directions[J]. Econometric Reviews, 2007, 26(1): 53-90. |
| [24] | Engle R F, Ghysels E, Sohn B. Stock market volatility and macroeconomic fundamentals[J]. The Review of Economics and Statistics, 2013, 95(3): 776-797. |
| [25] | 雷立坤, 余江, 魏宇, 等. 经济政策不确定性与我国股市波动率预测研究[J]. 管理科学学报, 2018, 21(6): 88-98. |
| Lei L K, Yu J, Wei Y, et al. Forecasting volatility of Chinese stock market with economic policy uncertainty[J]. Journal of Management Sciences in China, 2018, 21(6): 88-98. | |
| [26] | 夏婷, 闻岳春. 经济不确定性是股市波动的因子吗?——基于GARCH-MIDAS模型的分析[J]. 中国管理科学, 2018, 26(12): 1-11. |
| Xia T, Wen Y C. Does economic uncertainty matter for stock market Volatility? An analysis based on GARCH-MIDAS[J]. Chinese Journal of Management Science, 2018, 26(12): 1-11. | |
| [27] | 张一锋, 雷立坤, 魏宇. 羊群效应的新测度指数及其对我国股市波动的预测作用研究[J]. 系统工程理论与实践, 2020, 40(11): 2810-2824. |
| Zhang Y F, Lei L K, Wei Y. A new herd index and volatility forecasting of China’s stock market[J]. Systems Engineering-Theory & Practice, 2020, 40(11): 2810-2824. | |
| [28] | Shang Y, Liu L. An extension of stochastic volatility model with mixed frequency information[J]. Economics Letters, 2017, 155: 144-148. |
| [29] | 吴鑫育, 周海林, 汪寿阳, 等. 双杠杆门限随机波动率模型及其实证研究[J]. 管理科学学报, 2014, 17(7): 63-81. |
| Wu X Y, Zhou H L, Wang S Y, et al. A threshold stochastic volatility model with double leverage and its empirical test[J]. Journal of Management Sciences in China, 2014, 17(7): 63-81. | |
| [30] | 苑慧玲, 徐路, 周勇. 带有市场交易信息和随机微观噪声下的杠杆效应研究[J]. 中国管理科学, 2020, 28(9): 12-22. |
| Yuan H L, Xu L, Zhou Y. Leverage effect combining trading information with stochastic microstructure noise[J]. Chinese Journal of Management Science, 2020, 28(9): 12-22. | |
| [31] | 刘小军, 汪寿阳, 谢海滨. 已实现波动率预测: 非对称二次滑动平均模型[J]. 计量经济学报, 2022, 2(4): 930-945. |
| Liu X J, Wang S Y, Xie H B. Realized volatility forecasting: An asymmetric double moving average model[J]. China Journal of Econometrics, 2022, 2(4): 930-945. | |
| [32] | Shang Y, Zheng T. Mixed-frequency SV model for stock volatility and macroeconomics[J]. Economic Modelling, 2021, 95: 462-472. |
| [33] | Li T, Ma F, Zhang X, et al. Economic policy uncertainty and the Chinese stock market volatility: Novel evidence[J]. Economic Modelling, 2020, 87: 24-33. |
| [34] | 李木易, 方颖. 动态混合HGARCH模型的估计和预测[J]. 管理科学学报, 2020, 23(5): 1-12. |
| Li M Y, Fang Y. Estimation and forecasting of mixture HGARCH model[J]. Journal of Management Sciences in China, 2020, 23(5): 1-12. | |
| [35] | Malik S, Pitt M K. Particle filters for continuous likelihood evaluation and maximisation[J]. Journal of Econometrics, 2011, 165(2): 190-209. |
| [36] | Patton A J. Volatility forecast comparison using imperfect volatility proxies[J]. Journal of Econometrics, 2011, 160(1): 246-256. |
| [37] | Hansen P R, Lunde A, Nason J M. The model confidence set[J]. Econometrica, 2011, 79(02): 453-497. |
| [38] | Conrad C, Loch K. Anticipating long-term stock market volatility[J]. Journal of Applied Econometrics, 2015, 30(7): 1090-1114. |
| [39] | Wang X, Luo Y, Wang Z, et al. The impact of economic policy uncertainty on volatility of China’s financial stocks: An empirical analysis[J]. Finance Research Letters, 2021, 39: 101650. |
| [40] | Fleming J, Kirby C, Ostdiek B. The economic value of volatility timing using “realized” volatility[J]. Journal of Financial Economics, 2003, 67(3): 473-509. |
| [41] | Huang Y, Luk P. Measuring economic policy uncertainty in China[J]. China Economic Review, 2020, 59: 101367. |
| [42] | 邢艳春, 廖晗. 经济政策不确定性对中国股市波动率的影响[J]. 统计与信息论坛, 2023, 38(1): 71-80. |
| Xing Y C, Liao H. The impact of economic policy uncertainty on China’s stock market volatility[J]. Journal of Statistics and Information, 2023, 38(1): 71-80. | |
| [43] | Chen Z, Zhang L, Weng C. Does climate policy uncertainty affect Chinese stock market volatility?[J]. International Review of Economics & Finance, 2023, 84: 369-381. |
| [44] | Campbell J Y, Thompson S B. Predicting excess stock returns out of sample: Can anything beat the historical average?[J]. The Review of Financial Studies, 2008, 21(4): 1509-1531. |
| [1] | 彭红枫, 马世群, 王雪童. 经济政策不确定性的跨国动态溢出效应研究[J]. 中国管理科学, 2025, 33(7): 79-91. |
| [2] | 吴鑫育,谢海滨,马超群. 经济政策不确定性与人民币汇率波动率[J]. 中国管理科学, 2024, 32(8): 1-14. |
| [3] | 郭杨莉,马锋. 基于马尔科夫和混频数据模型的黄金期货市场波动率预测研究[J]. 中国管理科学, 2024, 32(1): 13-22. |
| [4] | 宫晓莉, 刘建民, 熊熊, 张维. 经济政策不确定性与国际金融网络间的尾部风险传染研究[J]. 中国管理科学, 2023, 31(7): 78-90. |
| [5] | 钟婉玲, 李海奇. 国际油价、宏观经济变量与中国股市的尾部风险溢出效应研究[J]. 中国管理科学, 2022, 30(2): 27-37. |
| [6] | 张跃军, 张晗, 王金丽. 考虑结构变化和长记忆性的国际原油价格波动率预测研究[J]. 中国管理科学, 2021, 29(9): 54-64. |
| [7] | 张同辉, 苑莹, 曾文. 投资者关注能提高市场波动率预测精度吗?——基于中国股票市场高频数据的实证研究[J]. 中国管理科学, 2020, 28(11): 192-205. |
| [8] | 胡成春, 陈迅. 经济政策不确定性、宏观经济与资产价格波动——基于TVAR模型及溢出指数的实证分析[J]. 中国管理科学, 2020, 28(11): 61-70. |
| [9] | 王正新, 姚培毅. 中国经济政策不确定性的跨国动态溢出效应[J]. 中国管理科学, 2019, 27(5): 78-85. |
| [10] | 吴鑫育, 赵凯, 李心丹, 马超群. 时变风险厌恶下的期权定价——基于上证50ETF期权的实证研究[J]. 中国管理科学, 2019, 27(11): 11-22. |
| [11] | 吴鑫育, 李心丹, 马超群. 双因子非对称已实现SV模型及其实证研究[J]. 中国管理科学, 2018, 26(2): 1-13. |
| [12] | 夏婷, 闻岳春. 经济不确定性是股市波动的因子吗?——基于GARCH-MIDAS模型的分析[J]. 中国管理科学, 2018, 26(12): 1-11. |
| [13] | 龚旭, 林伯强. 跳跃风险、结构突变与原油期货价格波动预测[J]. 中国管理科学, 2018, 26(11): 11-21. |
| [14] | 陈声利, 李一军, 关涛. 基于四次幂差修正HAR模型的股指期货波动率预测[J]. 中国管理科学, 2018, 26(1): 57-71. |
| [15] | 刘晓倩, 王健, 吴广. 基于高频数据HAR-CVX模型的沪深300指数的预测研究[J]. 中国管理科学, 2017, 25(6): 1-10. |
| 阅读次数 | ||||||
|
全文 |
|
|||||
|
摘要 |
|
|||||
|
||